x



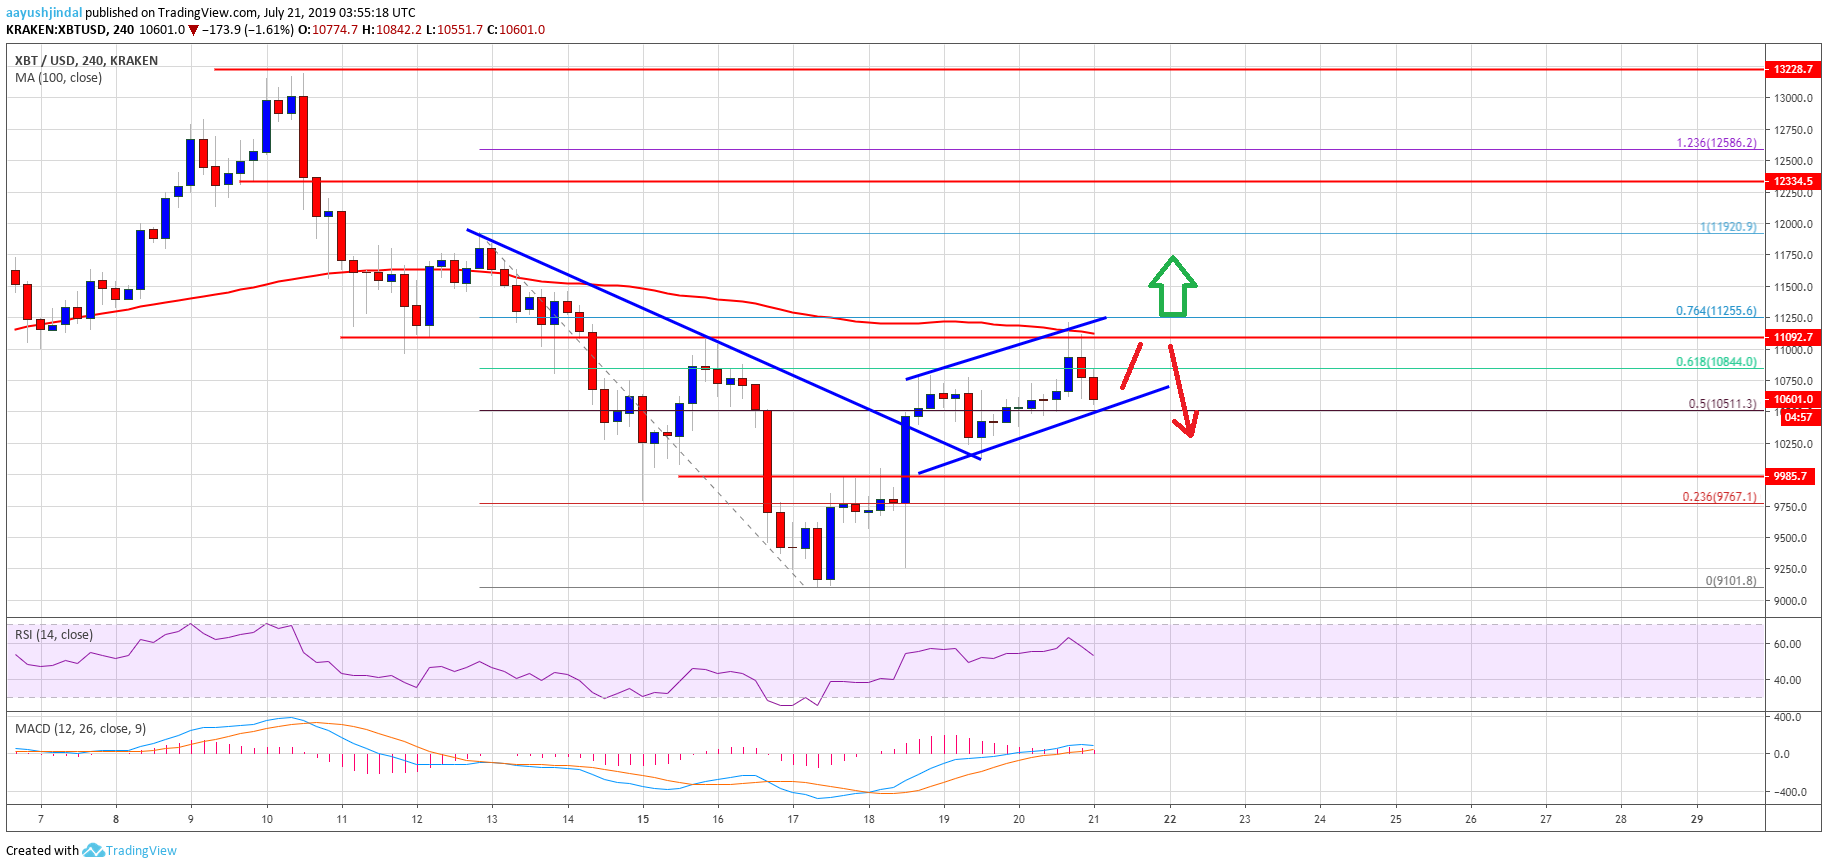
There was a solid upside correction initiated from the $9,100 swing low against the US Dollar.
The price gained traction after it broke the key $10,000 resistance area and traded towards $11,250.
There was a break above a major bearish trend line with resistance at $10,400 on the 4-hours chart of the BTC/USD pair (data feed from Kraken).
The pair tested a crucial resistance near $11,250 and it is currently correcting lower.
Bitcoin price is showing positive signs above the $10,250 support against the US Dollar. However, BTC must break the $11,250 resistance zone to continue higher in the near term.
Bitcoin Price Weekly Analysis (BTC)
This past week, bitcoin price extended its decline below the $10,000 support against the US Dollar. The BTC/USD pair even broke the $9,500 support and settled below the 100 simple moving average (4-hours). Finally, the price traded close to the $9,000 and formed a swing low near $9,100. A support base is formed above $9,200 and the price started an upside correction.
The recent wave was positive as the price broke the $10,000 and $10,250 resistance levels. The price even surpassed the 50% Fib retracement level of the last major slide from the $11,920 swing high to $9,101 swing low. Moreover, there was a break above a major bearish trend line with resistance at $10,400 on the 4-hours chart of the BTC/USD pair. The price climbed above the $10,800 resistance and even spiked above the $11,000 level.
However, the upward move was capped by the $11,250 resistance area and the 100 simple moving average (4-hours). The 76.4% Fib retracement level of the last major slide from the $11,920 swing high to $9,101 swing low also acted as a Looking at the chart, bitcoin price clearly tested a crucial resistance near $11,250. Therefore, a clear break above $11,250 is needed for the bulls to gain control in the coming sessions.
Major Resistance Level – $11,250strong resistance. As a result, the price started a downside correction below the $11,000 level. At the outset, it seems like there is a rising channel forming with support near $10,500.
If there is a downside break below the channel support, the price could decline towards the $10,250 or $10,000 support area. On the upside, the main resistance is near the $11,250 level and the 100 simple moving average (4-hours). A successful close above the $11,250 is must for more gains. If not, the price could start a fresh decrease below $10,500.
Technical indicators
4 hours MACD – The MACD for BTC/USD is struggling to gain traction in the bullish zone.
4 hours RSI (Relative Strength Index) – The RSI for BTC/USD is still above the 50 level.
Major Support Level – $10,250
By Aayush Jindal