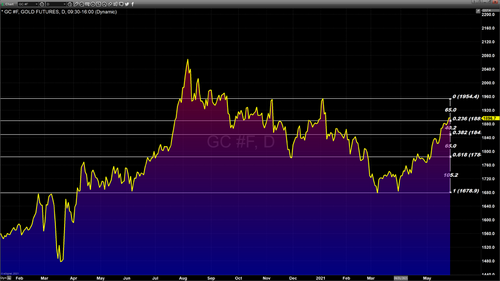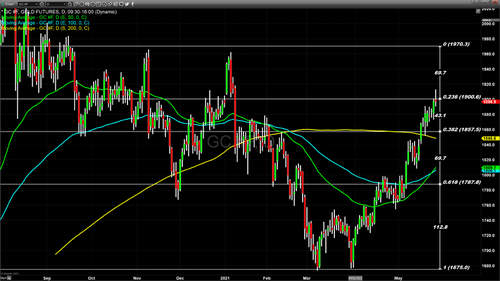

Yesterday gold futures closed at $1899.90 after trading to an intraday high above $1901. As trading resumed in Australia, it seemed that gold prices were trying to form a base above that elusive key psychological level. The high in trading last night took gold futures basis the most active June 2021 contract to $1913.30. However, those gains would be short-lived as the market moved back below $1900 as it traded in New York.
The rally that began at the end of March 2020 began at $1680 and reached an apex last night of $1913. In New York, the dollar traded fractionally higher but off the intraday high realized in overseas trading once the dollar began to trade in positive territory, even with the 10-year Treasury note, which traded lower and finally settled at 1.552% on Wednesday. As of approximately 10 PM, EST gold futures are currently trading down two dollars on the day and fixed at $1896.

However, any correction might be shallow and short-lived at best as the major fundamental drivers who have taken gold substantially higher are absolutely still in play. Traders and market participants continue to focus upon the recent uptick in inflation. The last CPI report indicated that our annualized inflation rate is now around 4.2%. Even though the Federal Reserve’s current mandate is allowing inflation to run hot and there is the perception that Fed actions will continue its dovish and extremely accommodative monetary policy for some prolonged period of time.
The question that market participants and investors are pondering is whether or not the Federal Reserve’s belief that any uptick in inflationary pressures is transitory and temporary, or that inflationary pressures will continue to run hot in a more sustained and systemic manner than the Fed is currently anticipating. The other major factor that has been taken gold higher has been dollar weakness which has been in a defined downtrend since the end of March 2020, which is the concurrent timeline that gold began the last leg of this current rally.

Our technical studies indicate that there is still solid support for gold between $1849 (the current fix of the 200-day moving average) and $1851, the 61.8% Fibonacci retracement. The data set used for the Fibonacci retracement begins at $1952 and ends at $1671. However, we do see a new support level coming into play which is $1879.60, based on the high trading prices achieved at the end of January 2020. It also must be noted that we did get a golden cross between the 50- and 100-day exponential moving averages. The last occurrence of a golden cross between these exponential moving averages was at the beginning of 2019. Using the same data set, the resistance we currently see occurs at $1898, which is the 78% Fibonacci retracement level.
Above that is the key psychological level of $1900 per ounce. Last night it seemed highly probable that an effective close above $1900 would make that price point a floor (support) rather than a ceiling (resistance). However, as of writing, $1900 remains a key and critical resistance area as it was not effectively able to hold a price point above that level for an extended period of time, in this case, less than 24 hours. It must be noted that this was the first attempt to break above $1900 since January of this year, and while it did not have the sustained bullish market sentiment to keep gold prices above that level, it does not mean that market forces will not take gold prices back above $1900. However, it does indicate that, at least for now, $1900 per ounce remains its next level of resistance to conquer if it is to continue on an upward trend.
By Gary Wagner
Contributing to kitco.com
