x




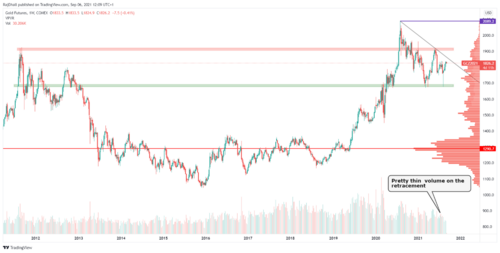
On the weekly chart, it seems easy to see why gold is stuck in a strong consolidation zone. It is best to pick up this timeframe at month-end and as August just closed the downside rejections seem evident. Another key consideration has to be the lack of volume over the last 5-6 weeks there seemed to be no real conviction in any of the downside moves.
Looking closer at the technicals, the green shaded area has supported the bulls and now the price could look to break the grey downward sloping trendline. If this is the case it could be a great indication that the yellow metal could be headed to the red resistance and possibly beyond that, to the high marked in purple.
What is
interesting is that the main volume area of this current distribution is at $1730/oz. These high-volume nodes act as a magnet for price and there could be another pullback on the cards. The lower level that should be of concern is the green consolidation low. If that breaks then it would make a lower high lower low chart pattern which Elliott Wave analysts could be interested in. The retracement wave 1-2 did stop at the 61.8% Fibonacci retracement but no lower low has been made. For me, if the $1919/oz wave high is broken that would invalidate any potential wave pattern down and the uptrend could resume. It is fair to say we are still in an uptrend on the weekly chart but in a very stubborn area.
.png)
By Rajan Dhall
For Kitco News
Kinesis Money the cheapest place to buy/sell Gold and Silver with Free secure storage