x




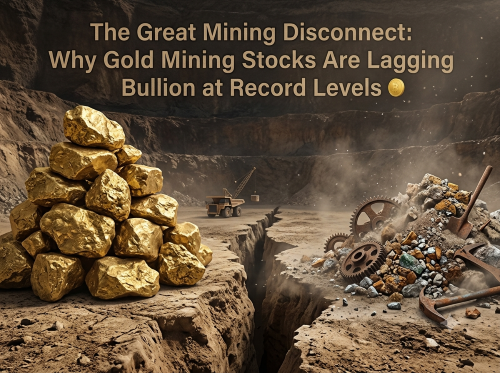
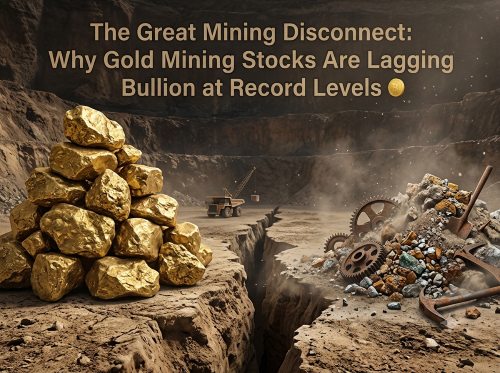
Over the past two decades, precious metals have experienced an extraordinary macro transformation. Gold has steadily surged, climbing more than sixfold and rewarding patient investors who sought safety in tangible assets. Yet, if you look at the equity markets, a baffling contradiction emerges: the very companies tasked with digging that gold out of the ground have largely failed to participate in the rally.
In fact, junior gold miners broadly display negative total returns dating back to 2006. Equity valuations across the resource sector have compressed to levels not seen in over half a century.
This dramatic gap between gold bullion and gold mining equities is not merely a brief market anomaly or a temporary cyclical dip. It represents a deep structural fracture within global financial markets—one that is currently creating one of the most compelling asymmetric opportunities in modern commodities investing.
To understand why this disconnect occurred, where the industry is heading next, and what it means for sound money investors, we must examine the underlying mechanics driving this historical divide.
Historically, mining equities represented a healthy share of global capital markets. At the dawn of the 20th century, resource stocks accounted for 9% to 10% of all publicly traded equities worldwide. By the mid-1950s and 1960s, that figure had expanded to roughly 12%.
Fast forward to today: gold mining stocks now represent just 2% of total global equity.
Data highlighted by industry veteran Rob McEwen reveals that the ratio between the Goldman Sachs Commodity Index and the S&P 500 has plunged to a 55-year low. Real assets and paper financial assets have never been so vastly misaligned.
How Did the Gap Become So Severe?
The breakdown was sequential, caused by a decade of painful structural shifts:
The resulting landscape is a sector objectively starved of fresh capital, trading at an extreme discount relative to historical norms and the underlying metal price. Should the mining sector’s share of global equities revert even partially toward its mid-century baseline, it would imply a potential 5x upside move across commodity-related equities.
For retail investors, the primary appeal of junior mining equities has always been operational leverage—the idea that a 20% rise in the spot price of gold ought to yield a 40% or 60% gain in the valuation of a well-run exploration company.
The reality over the past twenty years has been starkly different. While spot gold has soared, junior miners as a whole have delivered net negative returns.
The Institutional Liquidity Barrier
While high operational risks, dilutive capital raises, and management missteps play a role, the dominant obstacle holding junior miners back boils down to market liquidity.
Institutional money—the massive pension funds, sovereign wealth funds, and private equity firms that dictate market momentum—simply cannot participate in small-cap mining equities.
Consider an institutional portfolio manager overseeing £5 billion in assets. Taking a meaningful 1% allocation requires deploying £50 million. However, many junior exploration companies trade just £200,000 worth of shares on an average day.
An institutional fund attempting to build or exit a position of that size would completely distort the share price. If the thesis turns sour, the fund becomes trapped with no liquidity exit. Consequently, most large fund managers choose to ignore the junior sector entirely—not due to a lack of conviction in gold, but because the trading mechanics make execution impossible.
The Liquidity Cycle:
No Institutional Capital ➔ Depressed Share Prices ➔ Low Retail Interest ➔ Stagnant Trading Volume ➔ Institutional Capital Excluded
This dynamic creates a self-reinforcing loop. Without institutional participation, price momentum remains absent. Without momentum, retail trading volumes stay dormant, keeping the institutional doors firmly locked.
How does a sector break out of a two-decade liquidity trap?
For institutional allocators to return, two conditions must align simultaneously: sustained price momentum and expanding trading volume.
While gold breaking to multi-year highs establishes the macro backdrop, the operational spark that breaks the liquidity bottleneck is likely to come from corporate action within the industry itself: a massive wave of Mergers & Acquisitions (M&A).
Swelling Treasuries vs. Empty Pipelines
Major gold producers currently find themselves in a unique position. Thanks to elevated bullion prices, senior miners are generating robust cash flows and sitting on rapidly expanding corporate treasuries.
However, because these majors spent the last decade cutting exploration spending and selling off assets, they face a severe long-term problem: they have virtually no organic project pipeline to replace the gold they mine each year.
To maintain production levels and survive, senior producers will have no choice but to buy growth. They must acquire well-managed junior and mid-tier companies that hold high-grade, fully permitted deposits in safe jurisdictions.
When senior miners begin acquiring junior developers at premiums of 30%, 40%, or more, each transaction creates a high-profile price event. These acquisitions inject fresh liquidity into the market, boost daily trading volumes, and generate headline momentum—finally providing institutional capital with the exit routes and liquidity depth needed to re-enter the sector.
Beyond market liquidity and equity pricing, a second critical layer is often overlooked: the physical resource supply chain is profoundly constrained.
You cannot simply turn on a tap to produce more gold, copper, or strategic metals. Bringing a modern, large-scale mining project from initial discovery through environmental review, community consultation, permitting, and final construction typically takes 10 to 20 years. A sudden spike in market demand or metal prices cannot shorten this development timeline.
Typical Mine Development Timeline:
Discovery ➔ Permitting & Environmental Studies (7–12 Years) ➔ Construction (2–3 Years) ➔ Production
The Shift Toward Direct Asset Ownership
This physical reality is forcing major global institutions to bypass traditional financial markets and secure physical supply directly at the mine site:
When automobile makers hire geologists to buy stakes in raw mines, and central banks aggressively accumulate physical bullion, they are sending a clear signal: paper claims cannot substitute for physical commodities in a supply-constrained world.
For investors focused on long-term capital preservation and sound money principles, the massive divergence between gold and gold mining equities carries important takeaways:
1. Physical First, Equities Second
Physical gold and silver remain the ultimate foundation for monetary protection. Physical metal held in allocated, secure storage carries no management risk, no balance sheet liability, and no operational cost inflation. Those operational burdens are precisely what hampered corporate mining equities over the past decade. Physical bullion provides true systemic insurance.
2. An Asymmetric Setup for Equity Investors
For investors willing to allocate a portion of their capital to resource equities for leveraged growth, the macro backdrop is as favourable as it has been in decades:
Balancing the Risks
It is essential to remember that equity leverage cuts both ways. If the underlying spot price of gold experiences a deep market correction, high-beta junior mining equities can drop far faster than the physical metal. High operational costs, geopolitical friction, and unexpected execution delays remain real risks that demand careful position sizing.
Nevertheless, with senior corporate treasuries overflowing, physical supply chains tightening, and an M&A consolidation cycle looming on the horizon, the structural setup for gold mining equities is becoming impossible for thoughtful investors to ignore.
GoldSilver - 5X Move in Commodities Is Coming
Commodities just hit their lowest level against financial assets in 55 years.
In this conversation, GoldSilver's Maggie Lake sits down with Rob McEwen, founder of Goldcorp and Chairman and Chief Owner of McEwen Inc., live from the floor of the Rick Rule Symposium. With gold pulling back after its run earlier in the year, McEwen makes the case that this is the start of a commodities cycle, not the end of one.
Rob lays out why mining stocks sit at just 2% of global equity, down from 10 to 12% through most of the last century, and why closing that gap could mean a 5X move in commodity prices. He explains why carmakers and central banks are quietly buying up metal, and why the major miners have no growth pipeline left to feed the demand.
To explore the original discussion, watch the video analysis, and review the underlying market data in detail, visit the full source article on GoldSilver:
👉 Gold Went Up 600%. Your Mining Stocks Didn’t. Here’s Why.
Disclaimer: This article is provided for informational purposes only, mistakes may be made, and it's not offered or intended to be used as legal, tax, investment, financial, or any other advice.