x


Finding the Next Bitcoin All-Time High
There is a popular misconception that Bitcoin (BTC, “A-”) is a deflationary asset. It is not … yet, at least.
What happens is that every 10 minutes, 6.25 new BTC are minted into circulation. This corresponds to 328,500 BTC produced every year. Based on the current supply, this corresponds to an inflation rate of 1.68%.
However, every four years, by decree of its programming, BTC undergoes what is known as a halving. This means that the amount of BTC produced every 10 minutes gets cut down by one half.
The next halving is estimated to occur in 190 days, around April 24, 2024. Following the halving, 3.125 BTC will be produced every 10 minutes instead of 6.25.
This means Bitcoin’s yearly inflation rate will go down to 0.84%.
The chart below shows how the price of BTC has historically reacted following its scheduled halving.
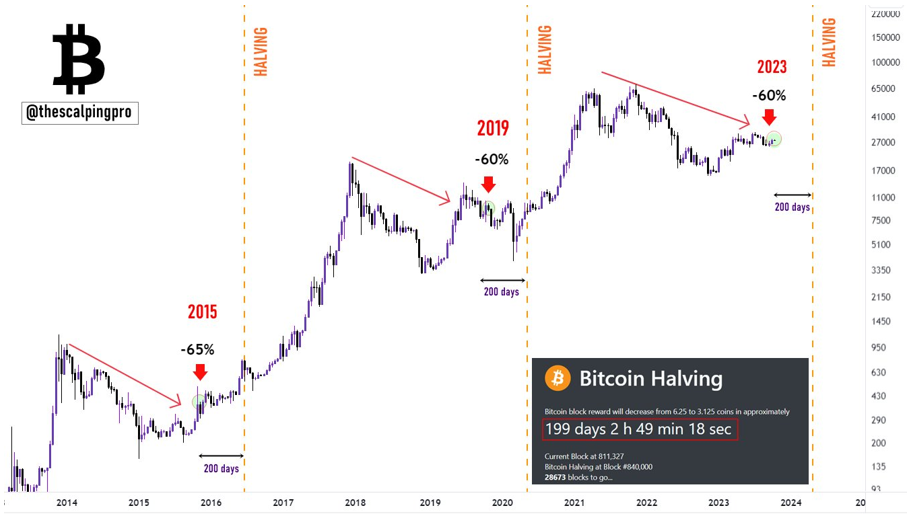
Figure 1: BTC price following its halving every four years. Source: @thescalpingpro. Click here to see full-sized image.
You can see that in each cycle, Bitcoin settles at roughly -60% from its previous all-time high about 200 days before the halving. The previous ATH for the latest cycle was roughly $69,184 and the current price at time of writing is $28,530.
This is about 41% of the latest ATH, so the -60% rule seems to hold.
What about price action after each Bitcoin halving dates? Just take a look:
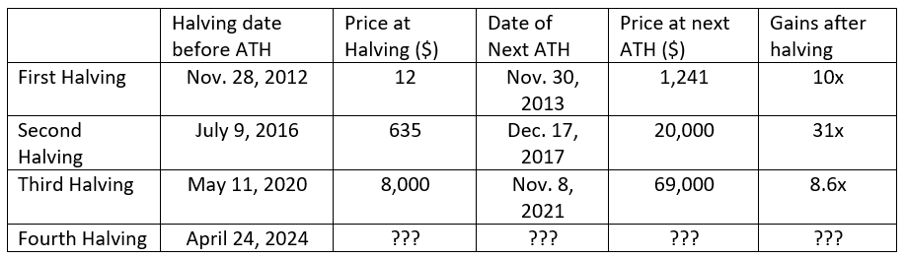
Figure 2: Halving dates and price gains after that. Click here to see full-sized image.
The gains after each halving from their respective halving dates to the ATH are 10x, 31x and 8.6x respectively.
So, what’s in store next after the next halving?
From previous data points — of which we have only three — no clear pattern emerges after each halving in regard to price action. It is interesting to note that each new high came roughly a year and a half post-halving. However, we have to be careful as that still isn’t enough data to determine a pattern.
But based on the data we do have, let’s assume the following:
With these data points, I could see the price Bitcoin’s next ATH coming in between $90,000 and $240,000.
Now, that’s a broad range. And since I made assumptions with the above data points, I want to see if we can narrow that down and check my calculations against a different measure for the all-time high.
So, let’s do that by calculating what a realistic market cap could be for Bitcoin at its ATH. I’ll do this by comparing Bitcoin’s market cap to that of gold.
As you know, Bitcoin and gold often correlate. It’s imperfect, but it is an asset that reacts to the market in a similar way to Bitcoin.
So, let’s assume:
With these parameters, my calculations would put the market cap of Bitcoin near $3 trillion when it hits its new all-time high. Additional calculations would then put the all-time high price near $180,000 — right in the middle of my previously calculated range.
I‘ll concede that neither of these calculations can be 100% accurate and shouldn’t be taken as gospel. However, they are based on educated assumptions shaped by previous history, and it is notable that they do overlap.
So, what does all this mean for you as an investor?
It means that the Bitcoin halving is coming up, and we anticipate the following all-time high will represent a significant profit opportunity for investors already holding Bitcoin … or who buy ahead of the halving.
Corrections between now and then can be seen by savvy investors as buying opportunities.
There is more that will affect Bitcoin’s price action between in that time, as well. In addition to the smaller cycles tracked by our Crypto Timing Model, we are also anticipating a convergence of macroeconomic factors to play out roughly around the same time as the halving.