
Bitcoin’s price teetered between $88,204 to $89,251 on March 6, 2025 at 3 p.m. ET, caught in a volatile tug-of-war between bulls and bears as its $1.74 trillion market cap faced a critical test. With a 24-hour trading volume surging to $46.19 billion and an intraday rollercoaster swing of $88,020–$92,756, traders are bracing for fireworks ahead of the White House Crypto Summit—a high-stakes poker game that could redefine crypto’s regulatory landscape.

Bitcoin
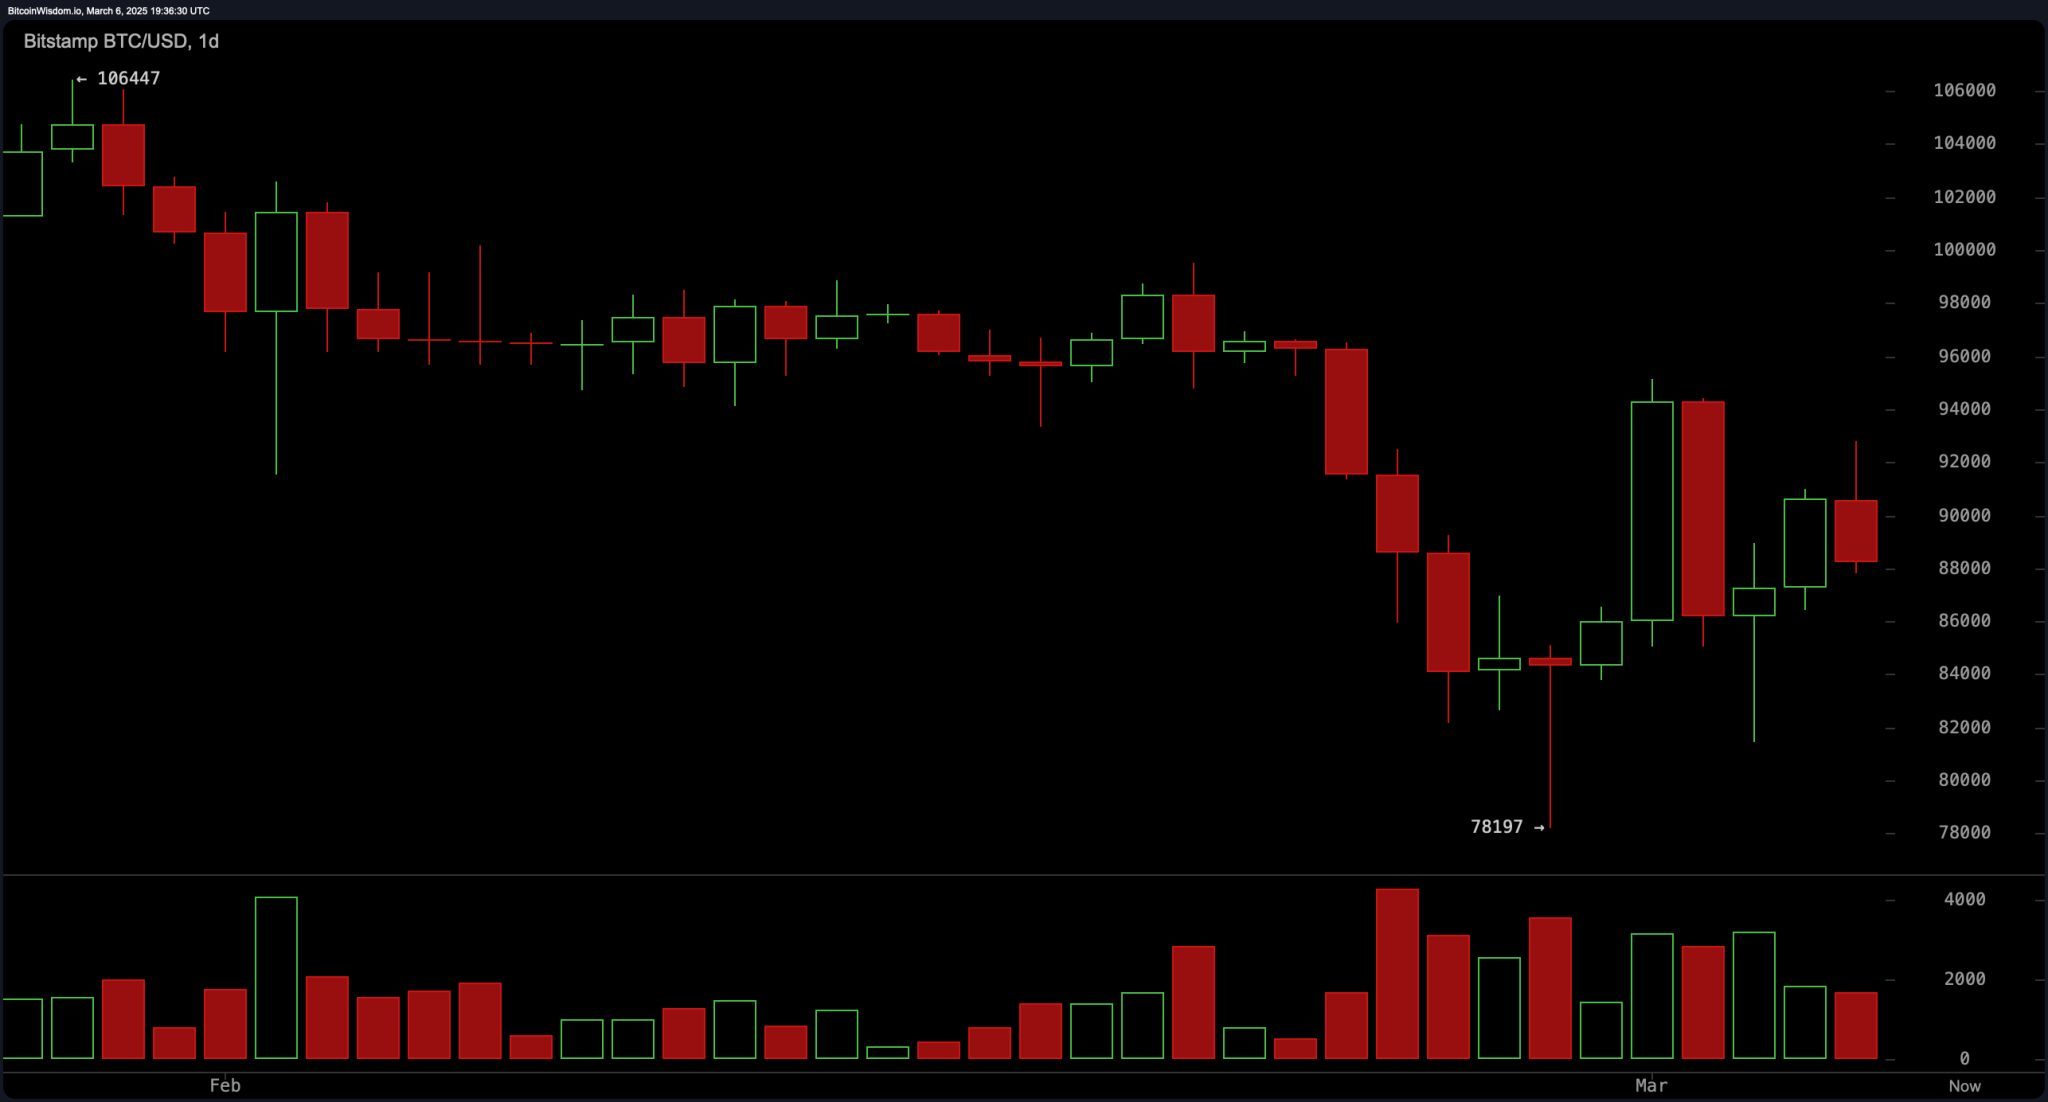
Analyzing the daily chart, bitcoin is in a correction phase following a peak at $106,447, with support at $78,000–$82,000 and resistance at $92,000–$95,000. Increasing volume during sell-offs contrasts with recent buying interest at lower levels, suggesting potential long positions if bitcoin holds above $88,000–$89,000. A failure to breach $92,000–$95,000 could trigger short opportunities.
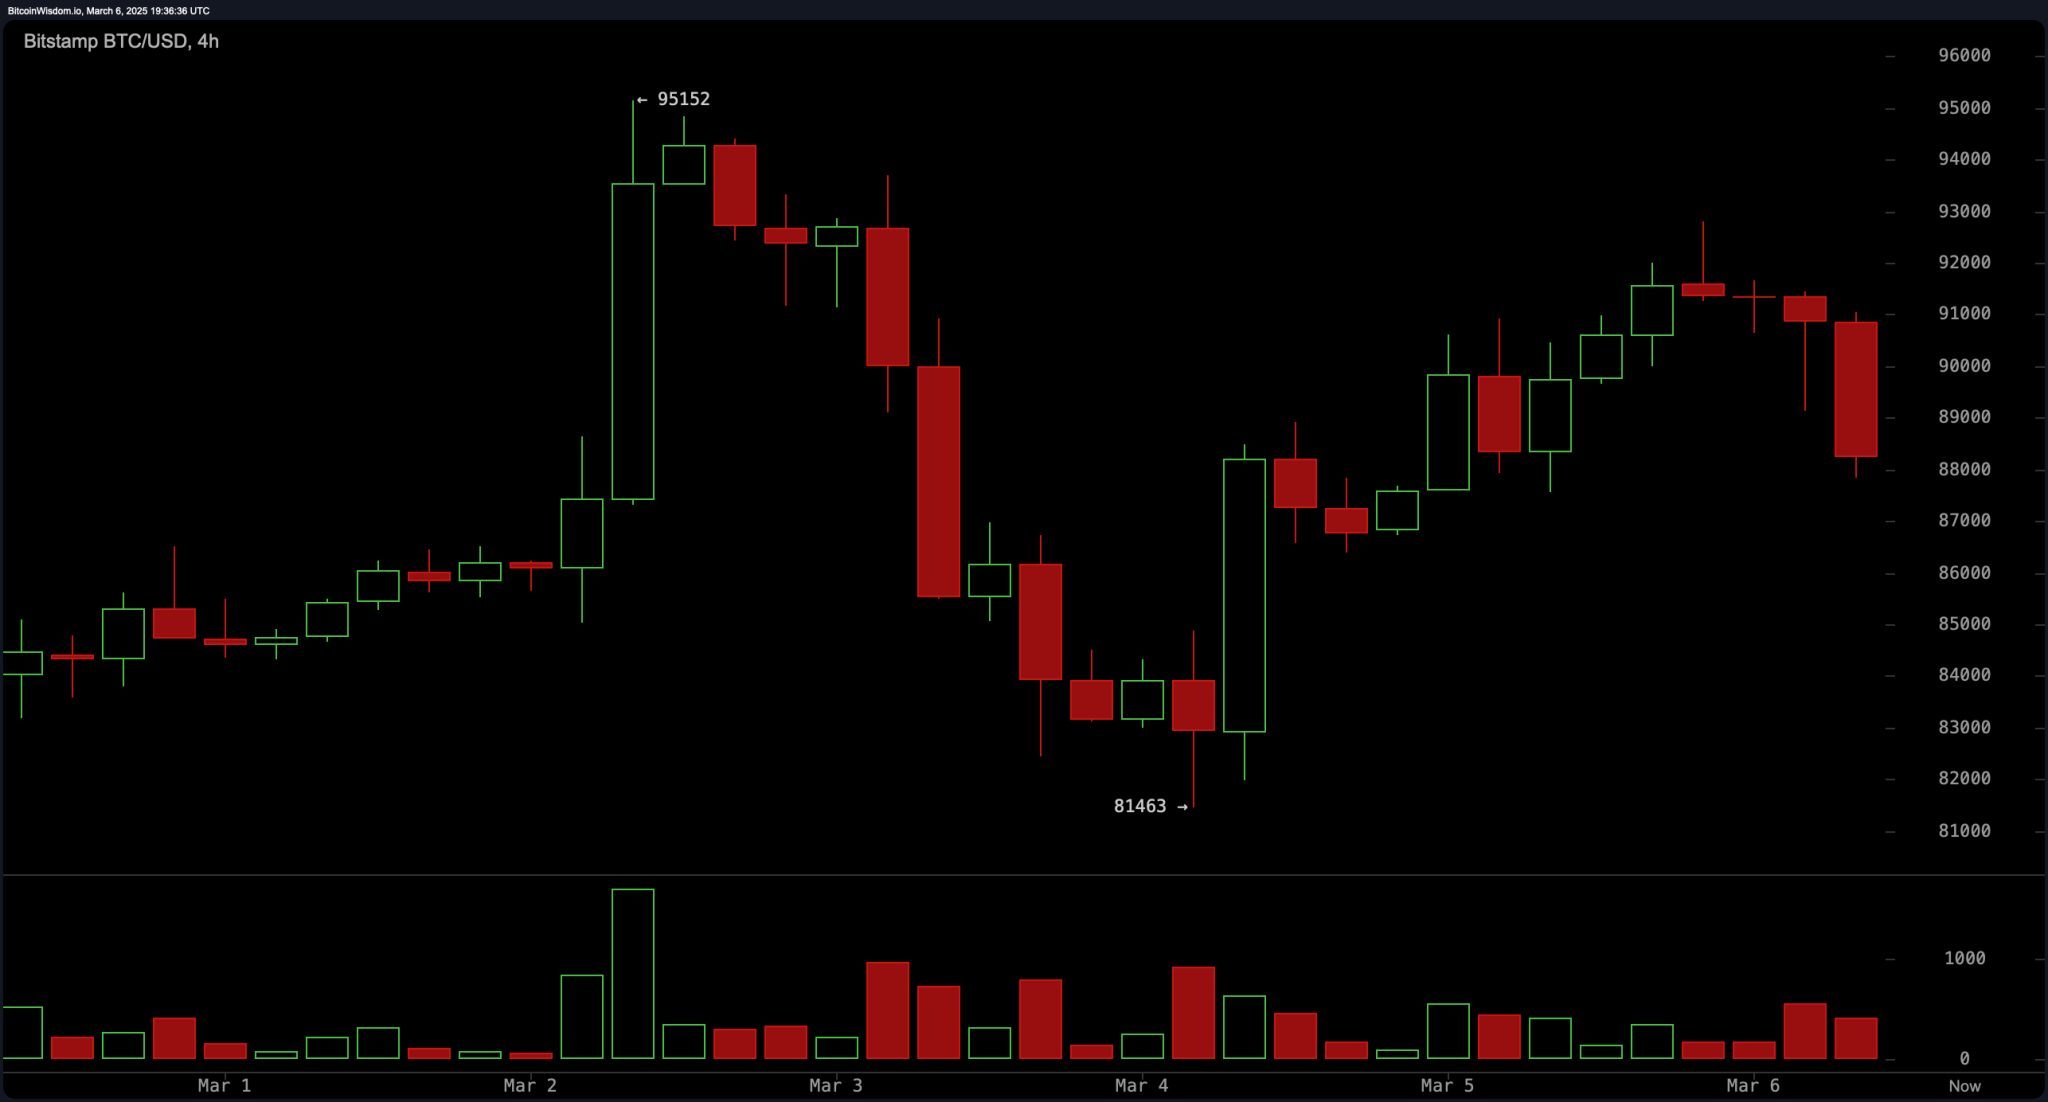
The 4-hour bitcoin chart reveals a volatile pattern: a sharp rally to $95,152, a retracement to $81,463, and a subsequent rebound. Immediate support lies at $87,000, with resistance at $92,000–$95,000 per BTC. Heavy volume during the decline transitioned to accumulation on green candles, signaling bullish confirmation above $88,000–$89,000. A rejection at $91,500–$92,500 may prompt short positions.
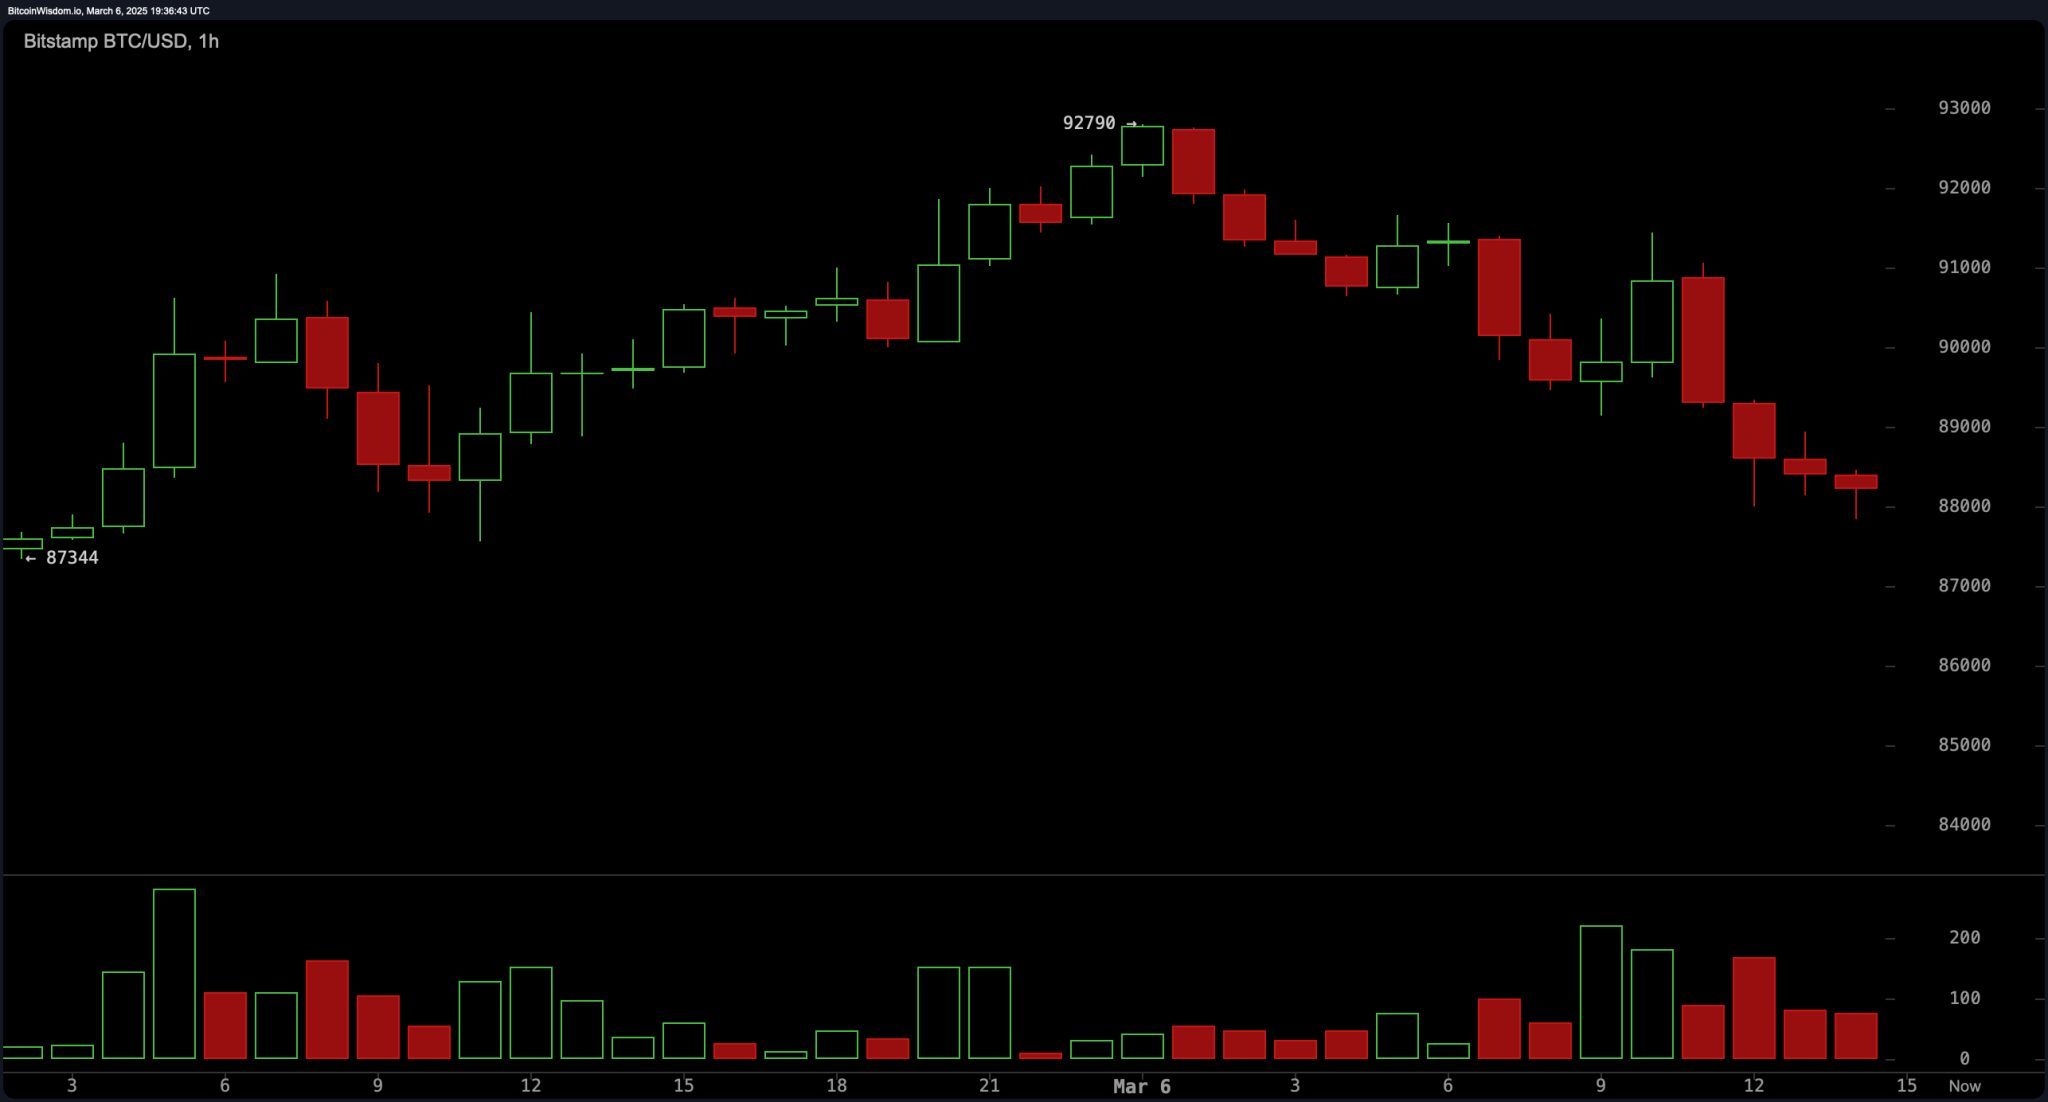
On the 1-hour chart, bitcoin’s short-term trend shows a pullback from $92,790, with support at $87,300–$88,000 and resistance at $90,000–$91,000 per BTC. Declining volume hints at seller exhaustion, offering a potential buying opportunity if bitcoin forms a bullish structure near $88,000. A breakdown below $87,000, however, could accelerate downward momentum.
Oscillators present mixed but mostly neutral signals. The relative strength index (RSI) reads 43, while the Stochastic holds at 49. The commodity channel index (CCI) is at -32, and the average directional index (ADX) shows 37, reflecting a neutral trend. The awesome oscillator (AO) is -5,272, and the momentum (MOM) at -3,686 suggests a bullish signal. Conversely, the moving average convergence divergence (MACD) at -2,619 indicates a bearish flash.
Moving averages (MAs) highlight short-term bearishness and long-term optimism. The exponential moving average (EMA) (10) at $89,039 and EMA (20) at $91,035 signal sells, while the simple moving average (SMA) (10) at $87,381 suggests a buy. Longer-term SMAs (200) and EMAs (200) at $82,891 and $85,801, respectively, show bullish bias. Short-term traders may lean on resistance near $92,000, while long-term holders could view dips as accumulation zones.
In summary, bitcoin faces a pivotal test at $92,000–$92,500. A sustained break above could target $95,000–$98,000, while a rejection may revisit $87,000–$88,000. Traders should monitor volume trends and oscillator shifts for confirmation, balancing short-term volatility with macro bullish underpinnings.
Bull Verdict:
– Breakout Potential: A sustained close above $92,000–$92,500 could fuel a rally to $95,000–$98,000, backed by bullish momentum (-3,686) and long-term SMAs (200) at $82,891–$85,801.
– Buyers in Control: Declining sell-side volume on the 1-hour chart and accumulation near $88,000 suggest exhaustion among sellers, aligning with a $1.74T market cap push.
Bear Verdict:
– Resistance Wall: Failure to crack $92,000–$93,000 risks a sharp drop to $87,000–$88,000, amplified by bearish EMAs (10, 20, 50) and MACD (-2,619) sell signals.
– Summit Uncertainty: White House Crypto Summit could trigger selling in a sell the news event, with a breakdown below $87,000 opening doors to $78,000 lows.