
Bitcoin is trading at $96,101 with a market capitalization of $1.907 trillion. Over the last 24 hours, its trade volume reached $21.413 billion, moving within an intraday range of $95,944 to $97,821.

Bitcoin
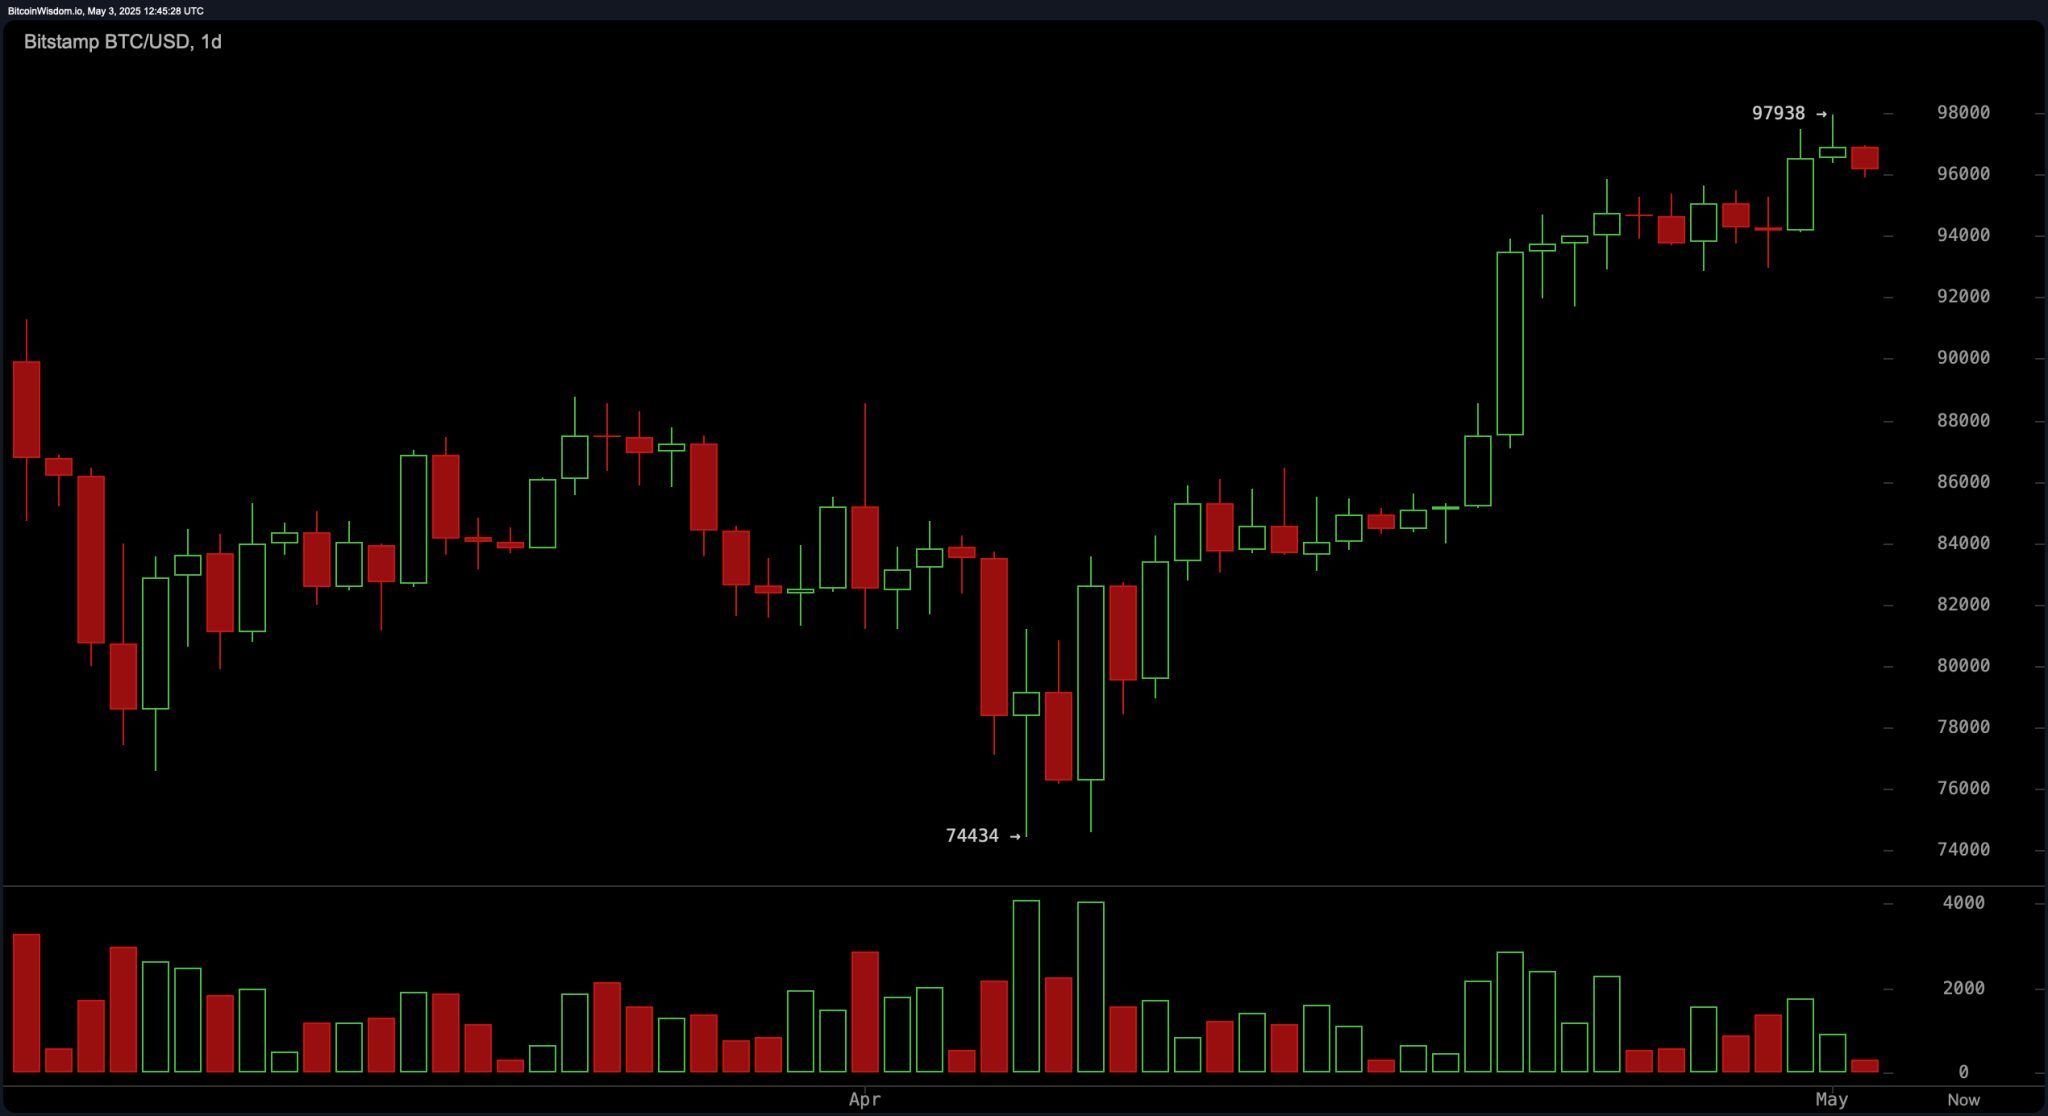
On the daily chart, bitcoin (BTC) maintains a bullish trend following a steady climb from the $74,434 level to a recent high of $97,938. However, the increasing volume observed during the ascent has begun to taper, suggesting that bullish momentum may be losing steam. A potential rising wedge pattern has formed, often signaling impending reversals. The immediate support zone sits between $90,000 and $91,000, with secondary support near $84,000. Traders are advised to monitor for a pullback towards the $90,000–$92,000 zone for long entries, with caution if volume increases below $90,000.
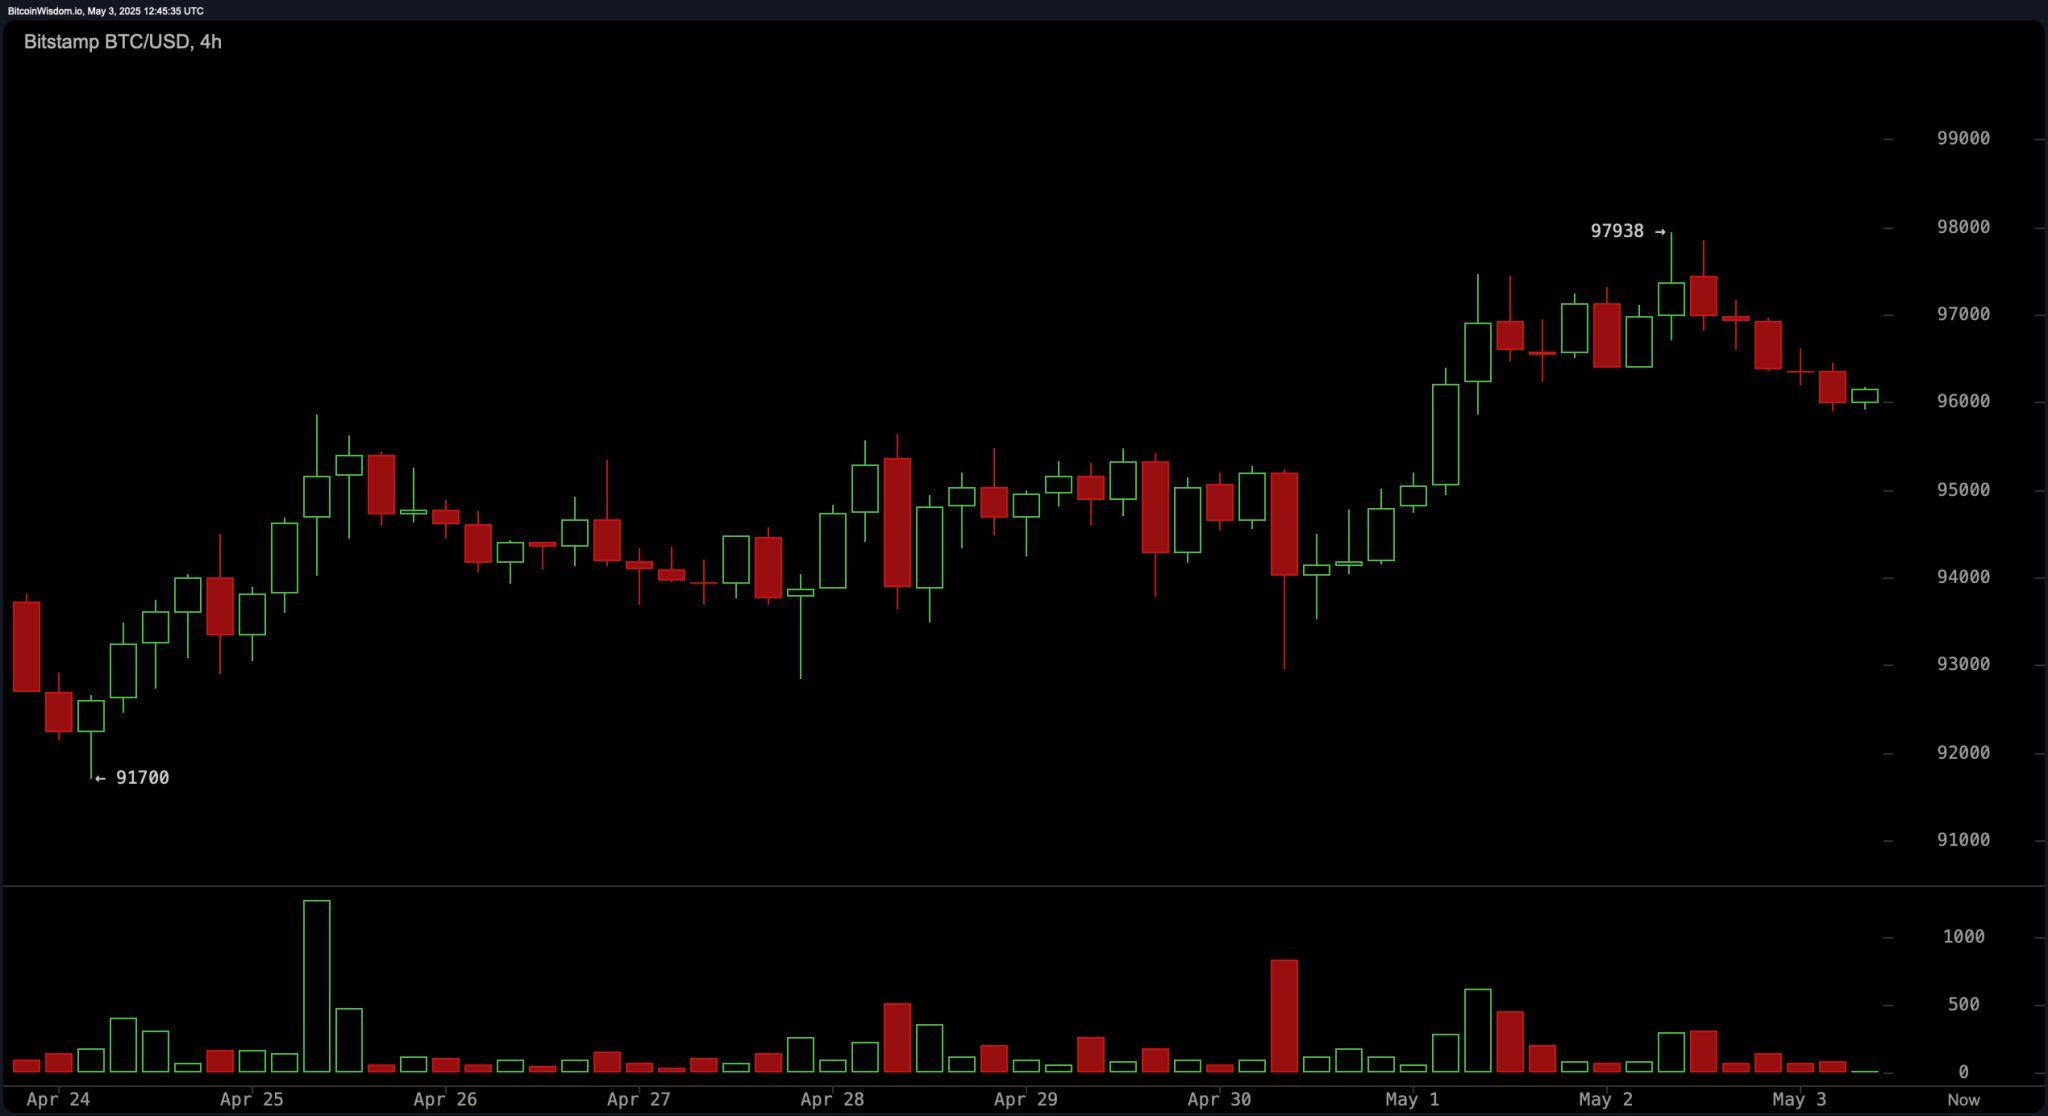
The 4-hour chart reveals a sideways-to-bearish structure developing since bitcoin peaked on May 1. Lower highs are being established, pointing toward a possible downtrend, especially in light of a pronounced red volume bar recorded on May 2, indicating growing selling pressure. The price is currently oscillating between $96,000 and $97,000, a zone of market indecision. A decisive break above $97,500 with solid volume could trigger short-term upside movement, whereas a breach under $96,000 might lead to a pullback towards the $94,000 support level.
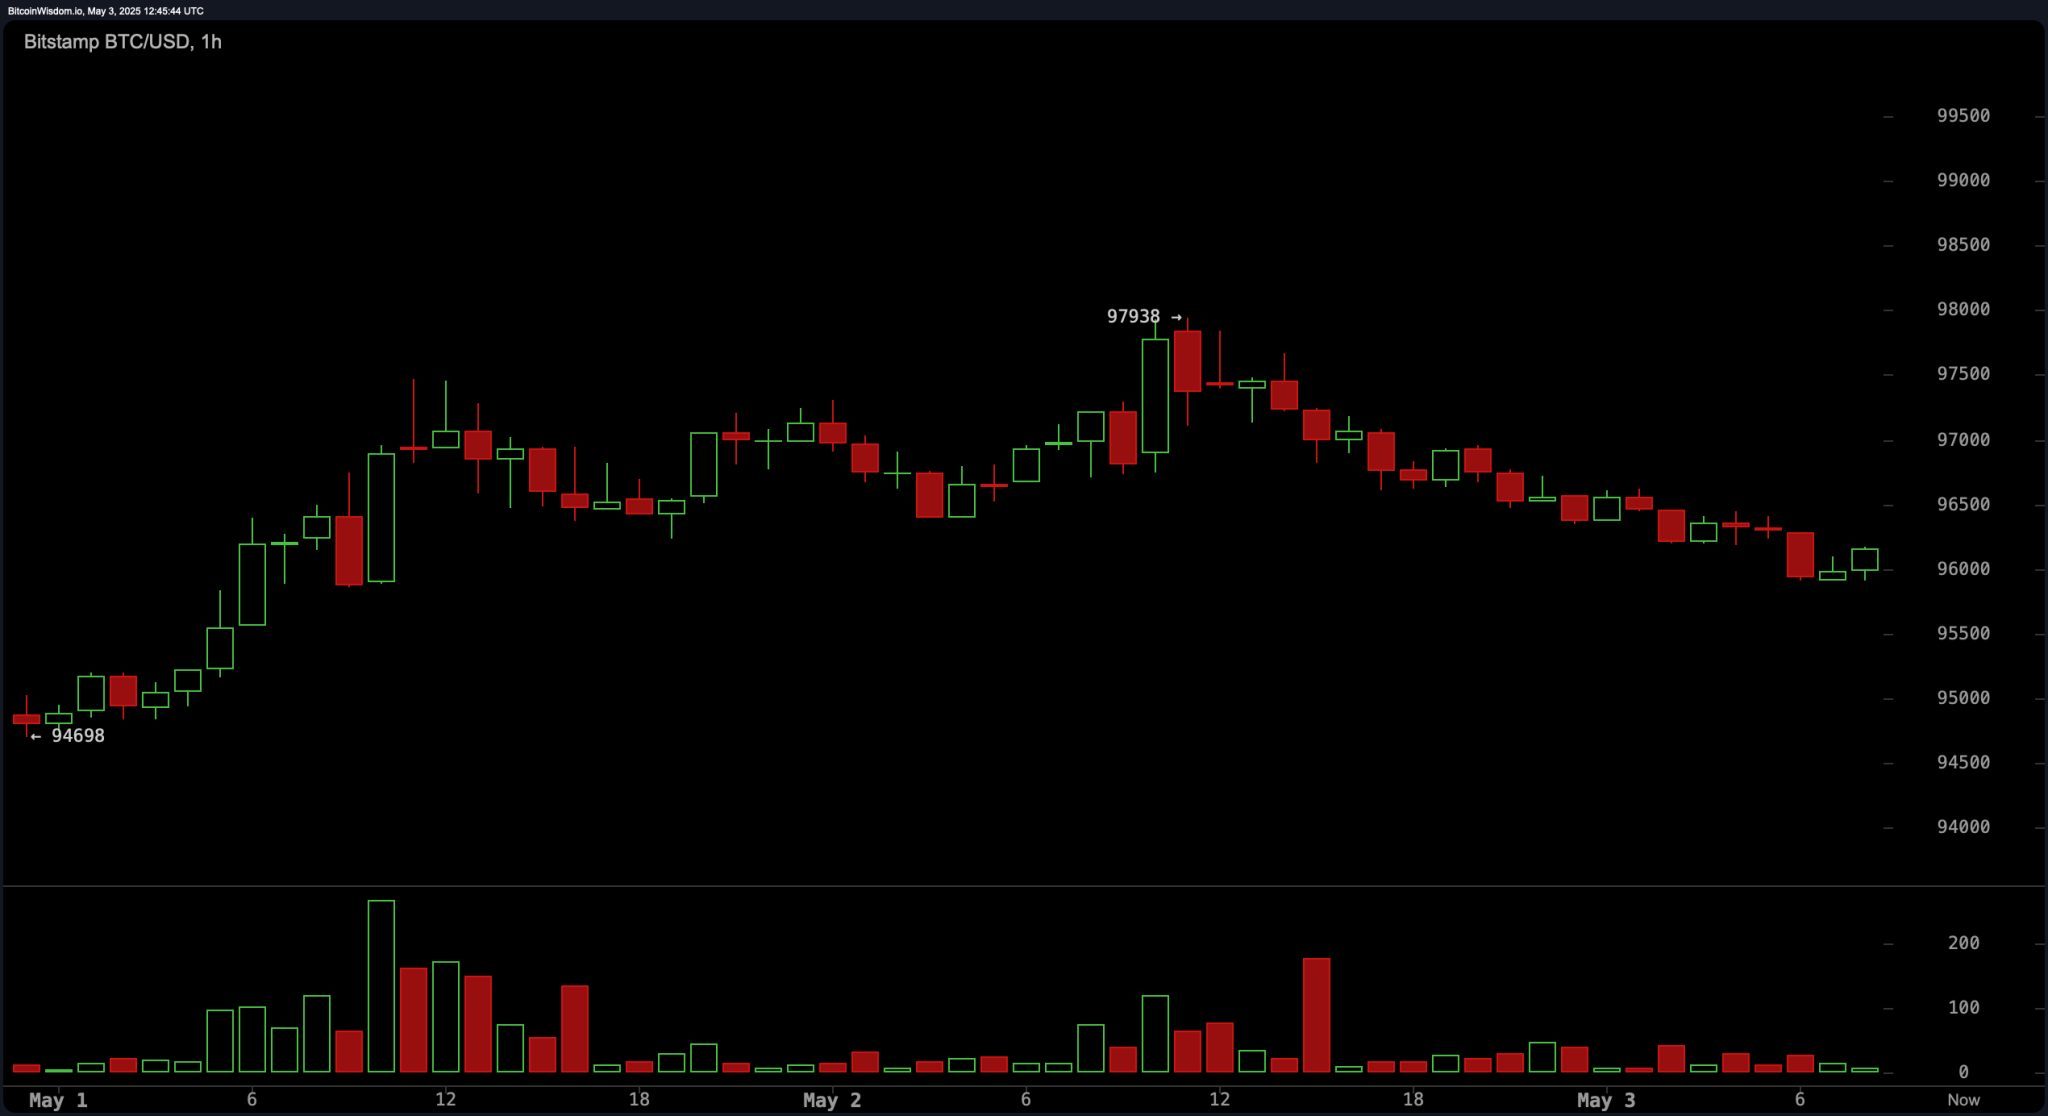
Short-term signals on the 1-hour chart confirm a bearish outlook. The double top pattern near $97,938 has resolved downward, and the trend is currently characterized by lower highs and lower lows. Volume on red candles has intensified, indicating that sellers dominate the intraday action. Immediate support lies between $95,500 and $95,800; a break below this band could clear a path to $94,500. Conversely, reclaiming $96,500 with strong bullish volume could open the door for intraday long scalps.
Oscillator readings on all timeframes present a generally neutral stance. The relative strength index (RSI), Stochastic percentage, commodity channel index (CCI), average directional index (ADX), and Awesome oscillator are all neutral. The momentum indicator, however, is flashing a sell signal, while the moving average convergence divergence (MACD) is in buy territory, reflecting a conflict between short-term selling pressure and longer-term bullish bias.
Moving averages remain overwhelmingly positive across the board. Both the exponential moving average (EMA) and simple moving average (SMA) values for 10, 20, 30, 50, 100, and 200 periods signal buy action. These sustained buy signals from long-term moving averages reinforce the broader uptrend, despite recent consolidative or bearish pressures in lower timeframes.
Bull Verdict:
Despite signs of short-term exhaustion and consolidation, bitcoin remains structurally bullish across higher timeframes. The consistent buy signals from all major moving averages, along with resilient support zones and a buy indication from the moving average convergence divergence (MACD), suggest that a healthy pullback may precede another upward leg, especially if buyers reclaim control above $97,500 with volume.
Bear Verdict:
Near-term technicals reflect mounting selling pressure and weakening momentum, particularly on the 1-hour and 4-hour charts. The presence of a rising wedge on the daily chart, coupled with a double top breakdown and bearish volume spikes, raises the probability of a deeper correction toward the $94,000–$90,000 support levels if downward momentum accelerates.