
Bitcoin is currently trading at $102,980, securing a market capitalization of $2.04 trillion. With a 24-hour trade volume of $23.32 billion and an intraday range between $102,801 and $104,263, the market is reflecting a phase of consolidation following a robust upward movement.

Bitcoin
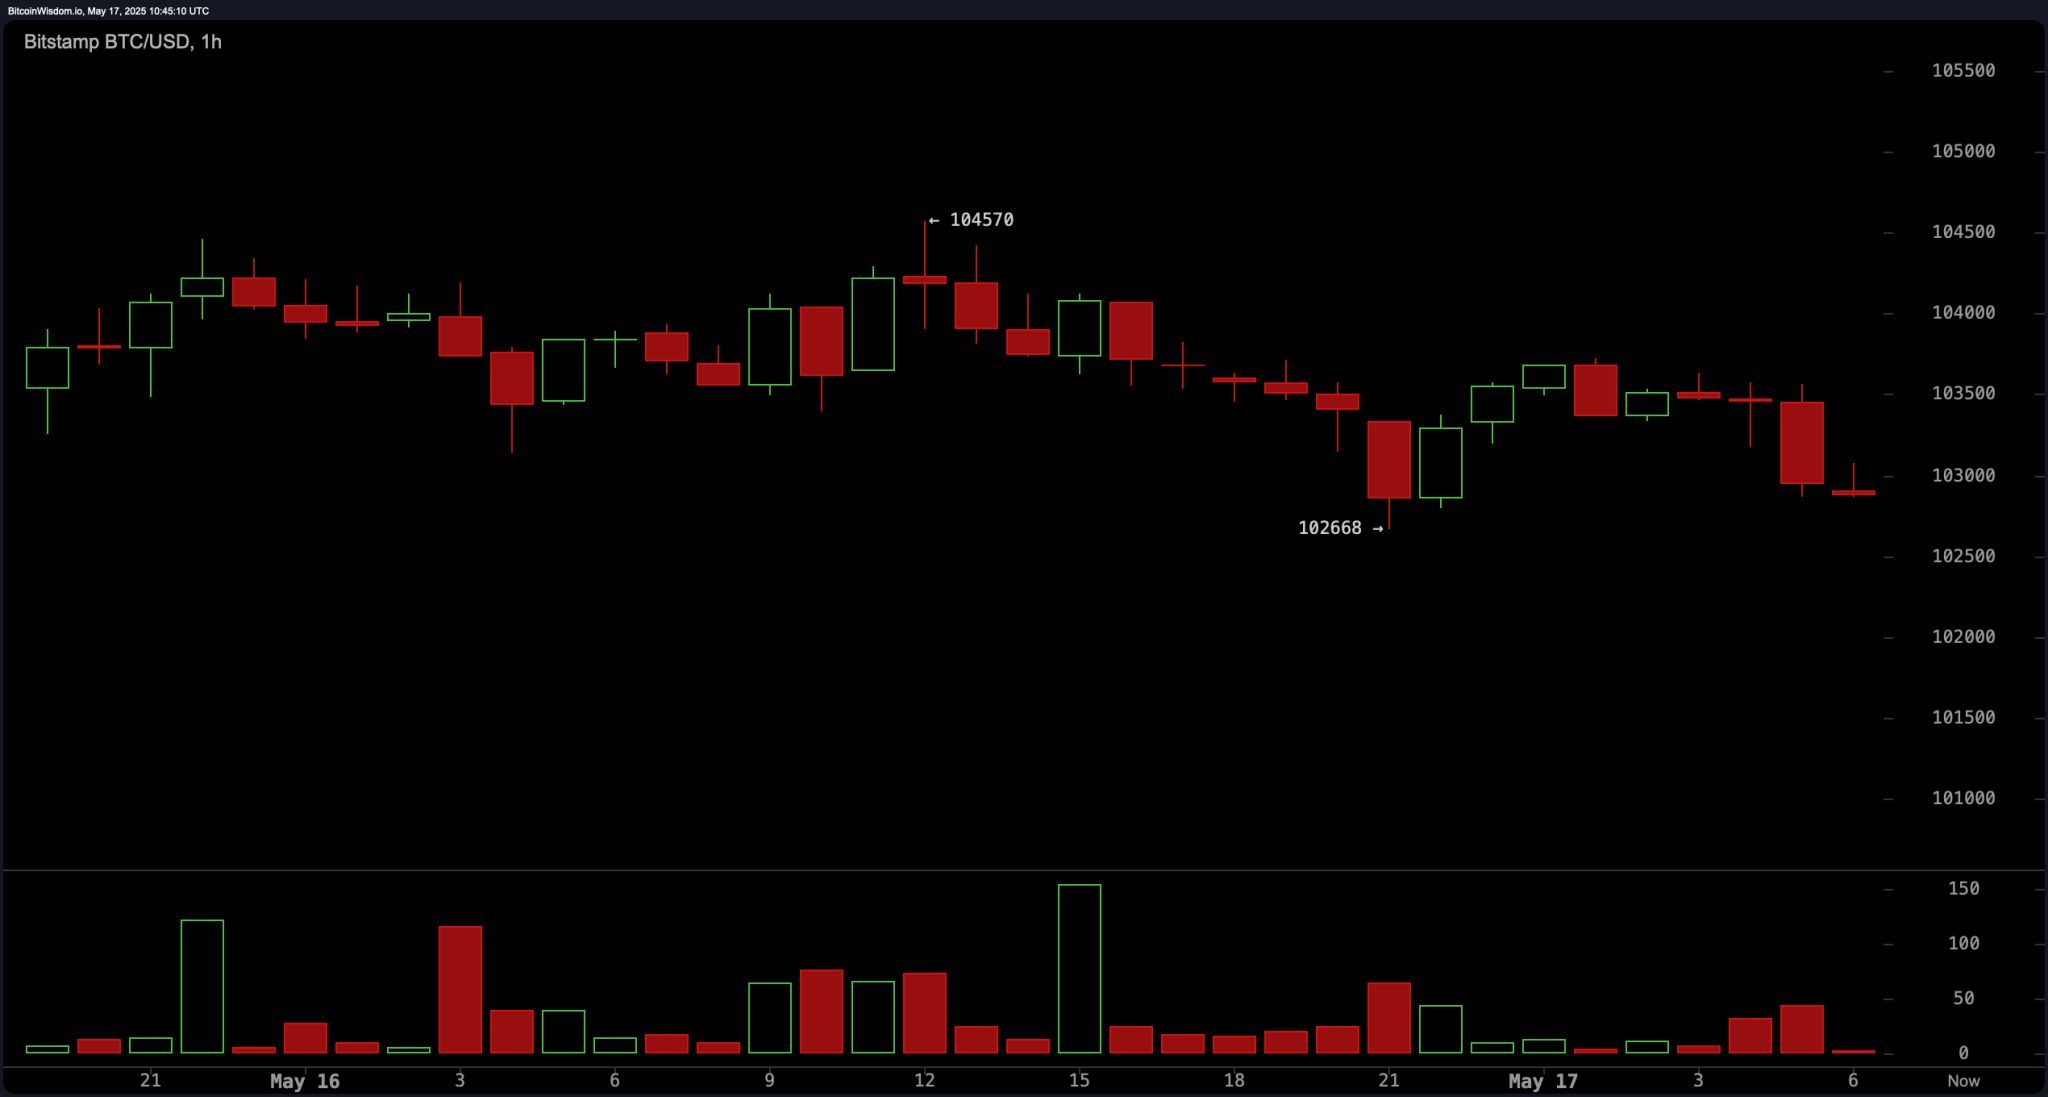
The 1-hour chart indicates a clear short-term downtrend, with price action forming consistent lower highs and testing the $102,668 level as a potential bounce point. Volume has notably decreased during bullish attempts, suggesting weakened buying momentum. Immediate resistance lies between $103,800 and $104,000, with bearish engulfing patterns offering tactical short entries in that zone. Scalping opportunities may arise if bitcoin sustains support at $102,600 with a corresponding uptick in volume.
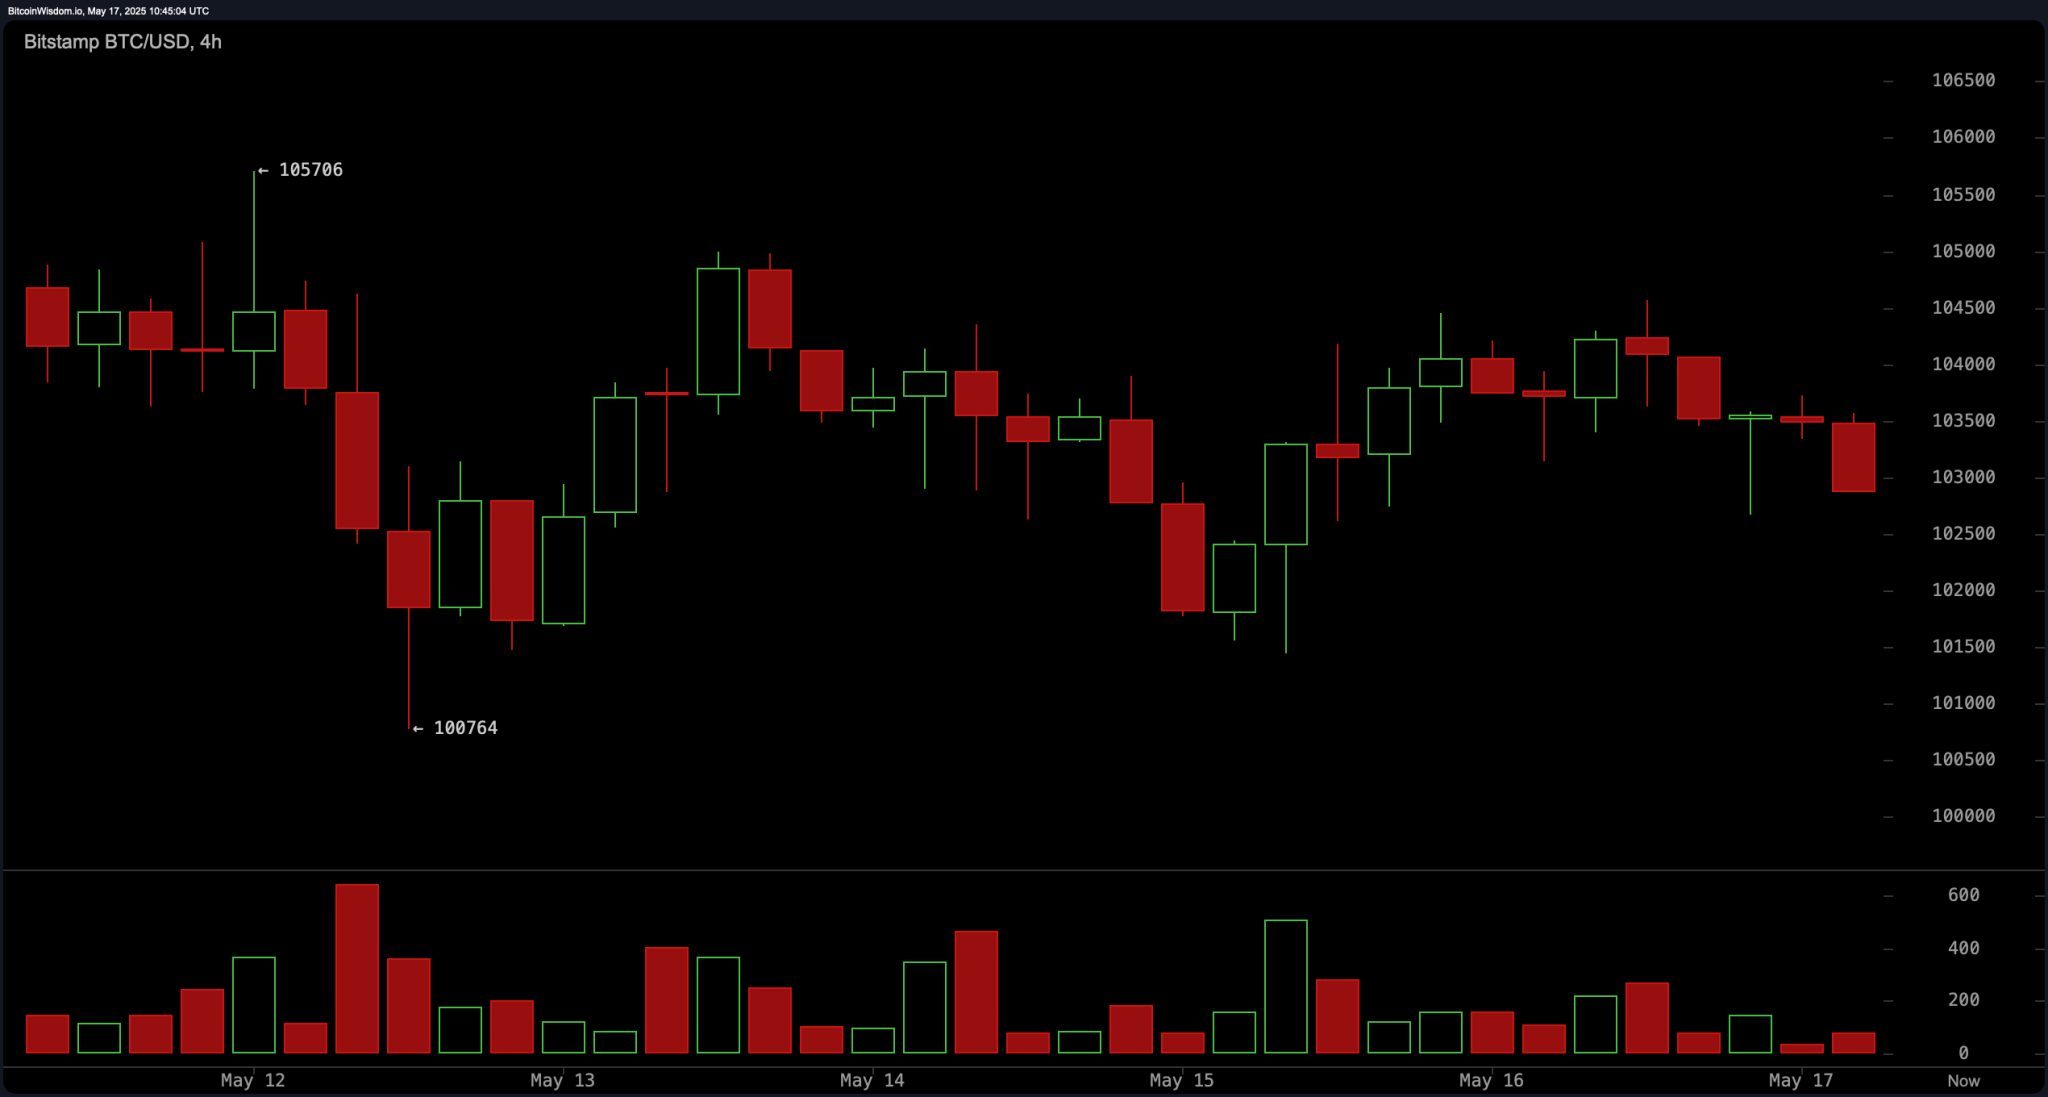
On the 4-hour chart, the structure is more mixed, highlighting a brief rally to $105,706 that has since reversed into a lower high and lower low pattern. The current bearish trajectory is supported by heavier volume on down candles, underscoring prevailing sell-side pressure. Resistance at $104,500 remains critical; only a reclaim and hold above this level would shift sentiment toward bullish. Meanwhile, the $100,500 to $100,800 support band is a key area to monitor for a reaction, either as a continuation point or a potential reversal zone.
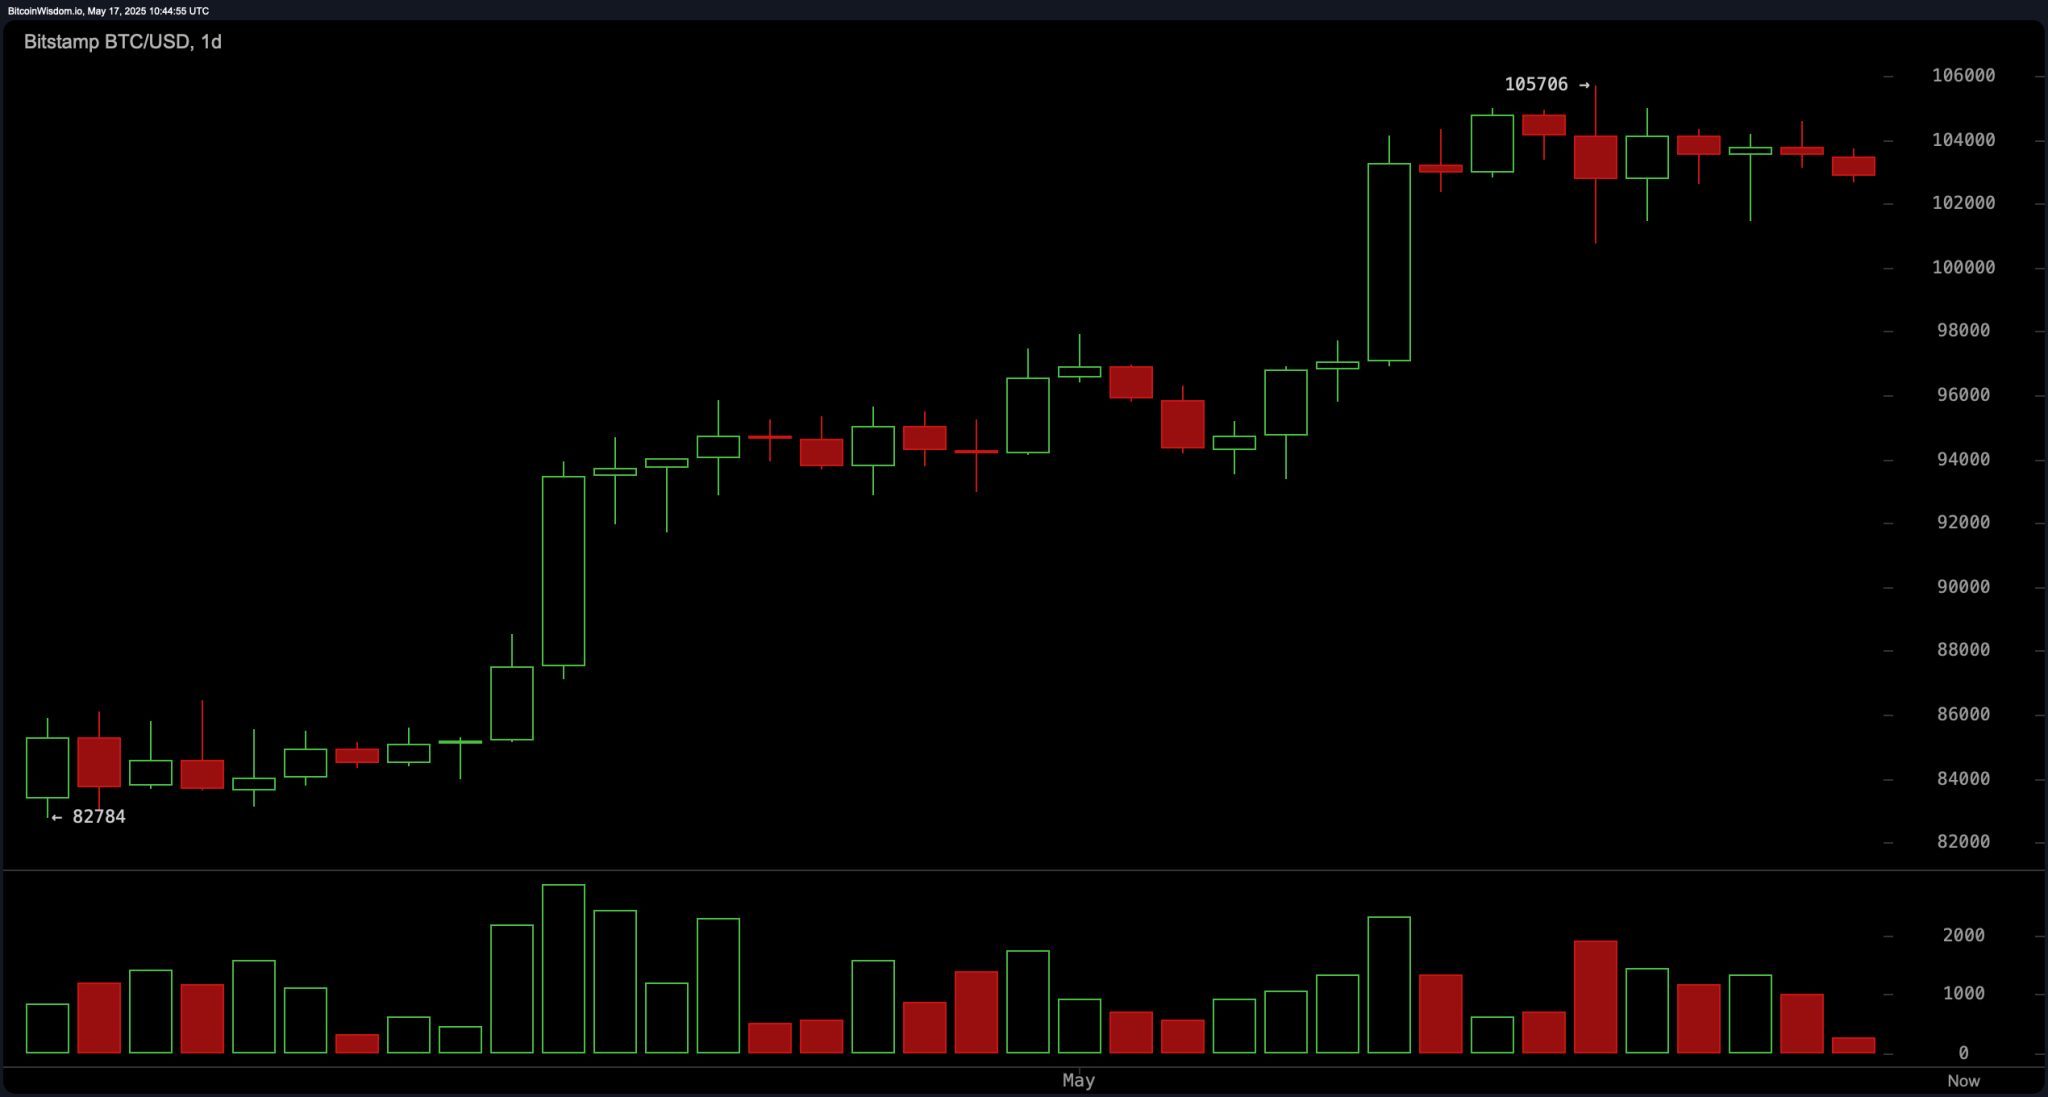
The daily chart provides a broader context of bitcoin’s uptrend since late April, rising from approximately $82,784 to a high of $105,706. However, this macro bullish trend is now confronting signs of fatigue, with small-bodied candles and upper wicks pointing to indecision. A notable drop in volume near recent highs further signals a lack of strong buying conviction. The $96,000 to $98,000 zone serves as a structural support, while $105,700 remains a formidable resistance level that must be decisively broken to extend the uptrend.
From a technical indicators standpoint, most oscillators including the relative strength index (RSI), Stochastic, commodity channel index (CCI), average directional index (ADX), and Awesome oscillator are showing neutral readings, suggesting a lack of strong momentum in either direction. Notably, the momentum and moving average convergence divergence (MACD) indicators are signaling sell conditions, aligning with short-term bearish patterns observed on lower timeframes
Conversely, moving averages continue to reflect a predominantly bullish stance. The exponential moving averages (EMAs) across 10, 20, 30, 50, 100, and 200 periods all indicate buying strength, except the 10-period simple moving average (SMA) which is flashing a bearish signal. The alignment of longer-period EMAs above their respective SMAs reinforces the overall uptrend, albeit tempered by current market hesitation. Sustaining this structure requires maintaining support above $100,000, while a break below this psychological level could initiate a more pronounced correction.
Bull Verdict:
Bitcoin remains in a broader uptrend supported by strong positioning of its exponential moving averages, with the daily chart confirming higher macro structure since late April. If price maintains above the $100,500–$102,600 support zone and successfully breaks through the $105,700 resistance with volume confirmation, bullish continuation toward new highs remains firmly in play.
Bear Verdict:
Despite the macro uptrend, short- and medium-term charts reveal bearish momentum, declining volume on rallies, and resistance at $104,500–$105,700. Failure to reclaim these levels, coupled with a breakdown below $100,000, could trigger a deeper corrective phase and invalidate the short-term bullish setup.