
Bitcoin price stood at $105,382 on June 3, 2025, maintaining a market capitalization of $2.094 trillion with a 24-hour trading volume of $25.18 billion. Intraday volatility showed a price range between $103,984 and $106,443, reflecting a market in search of directional clarity.

Bitcoin
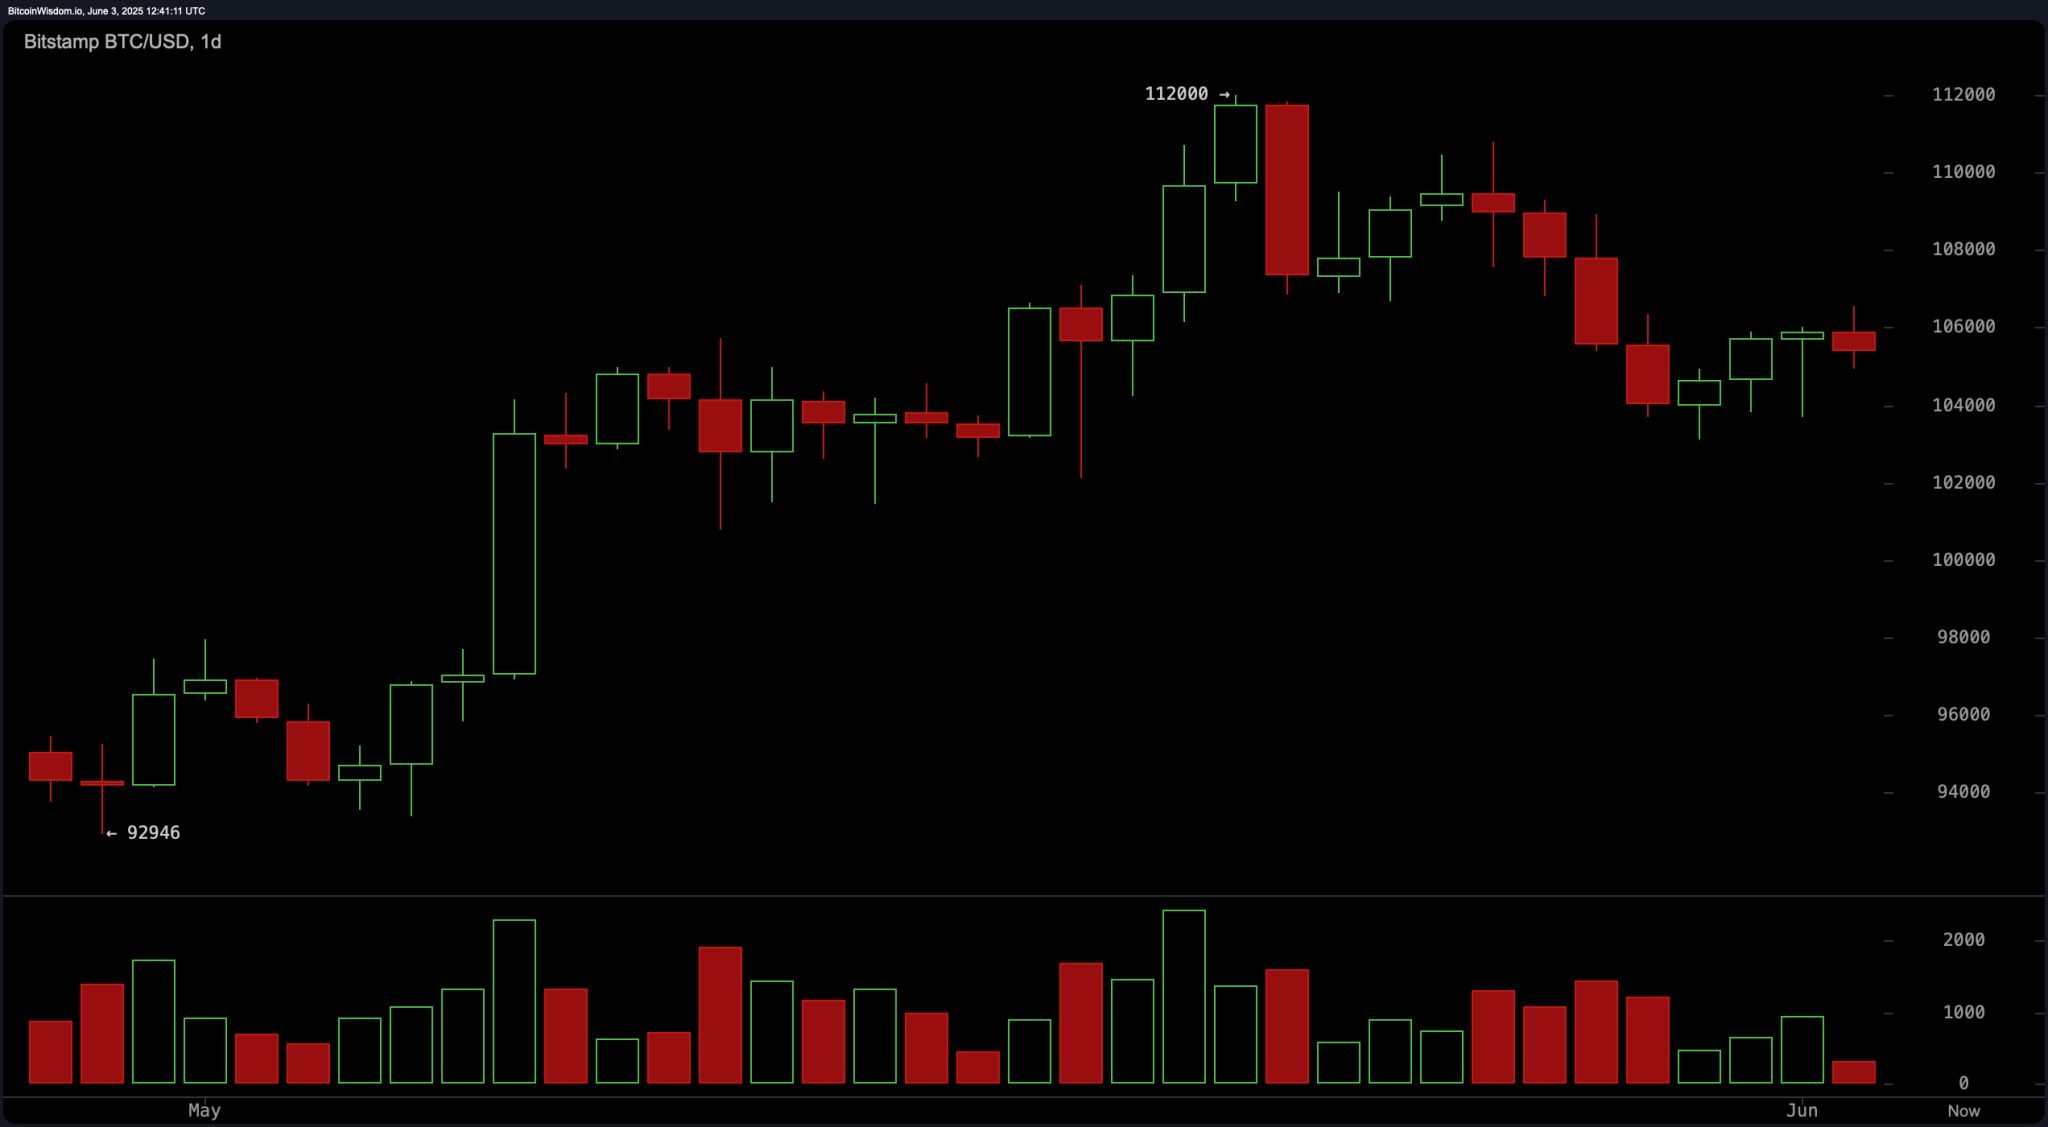
On the daily chart, bitcoin (BTC) appears to be consolidating after a recent retreat from the $112,000 level, trading tightly between $105,000 and $106,000. The reduction in selling volume hints at a possible exhaustion of bearish pressure, though a decisive breakout is yet to materialize. A close above $107,000 on strong volume could validate a bullish reversal, while a drop below $103,000 might confirm a continuation of the downtrend. Short-term targets in either direction are set at $110,000–$112,000 for upside moves and $98,000–$100,000 on the downside, respectively. The trend here remains neutral, underscored by diminishing volume and market indecision.
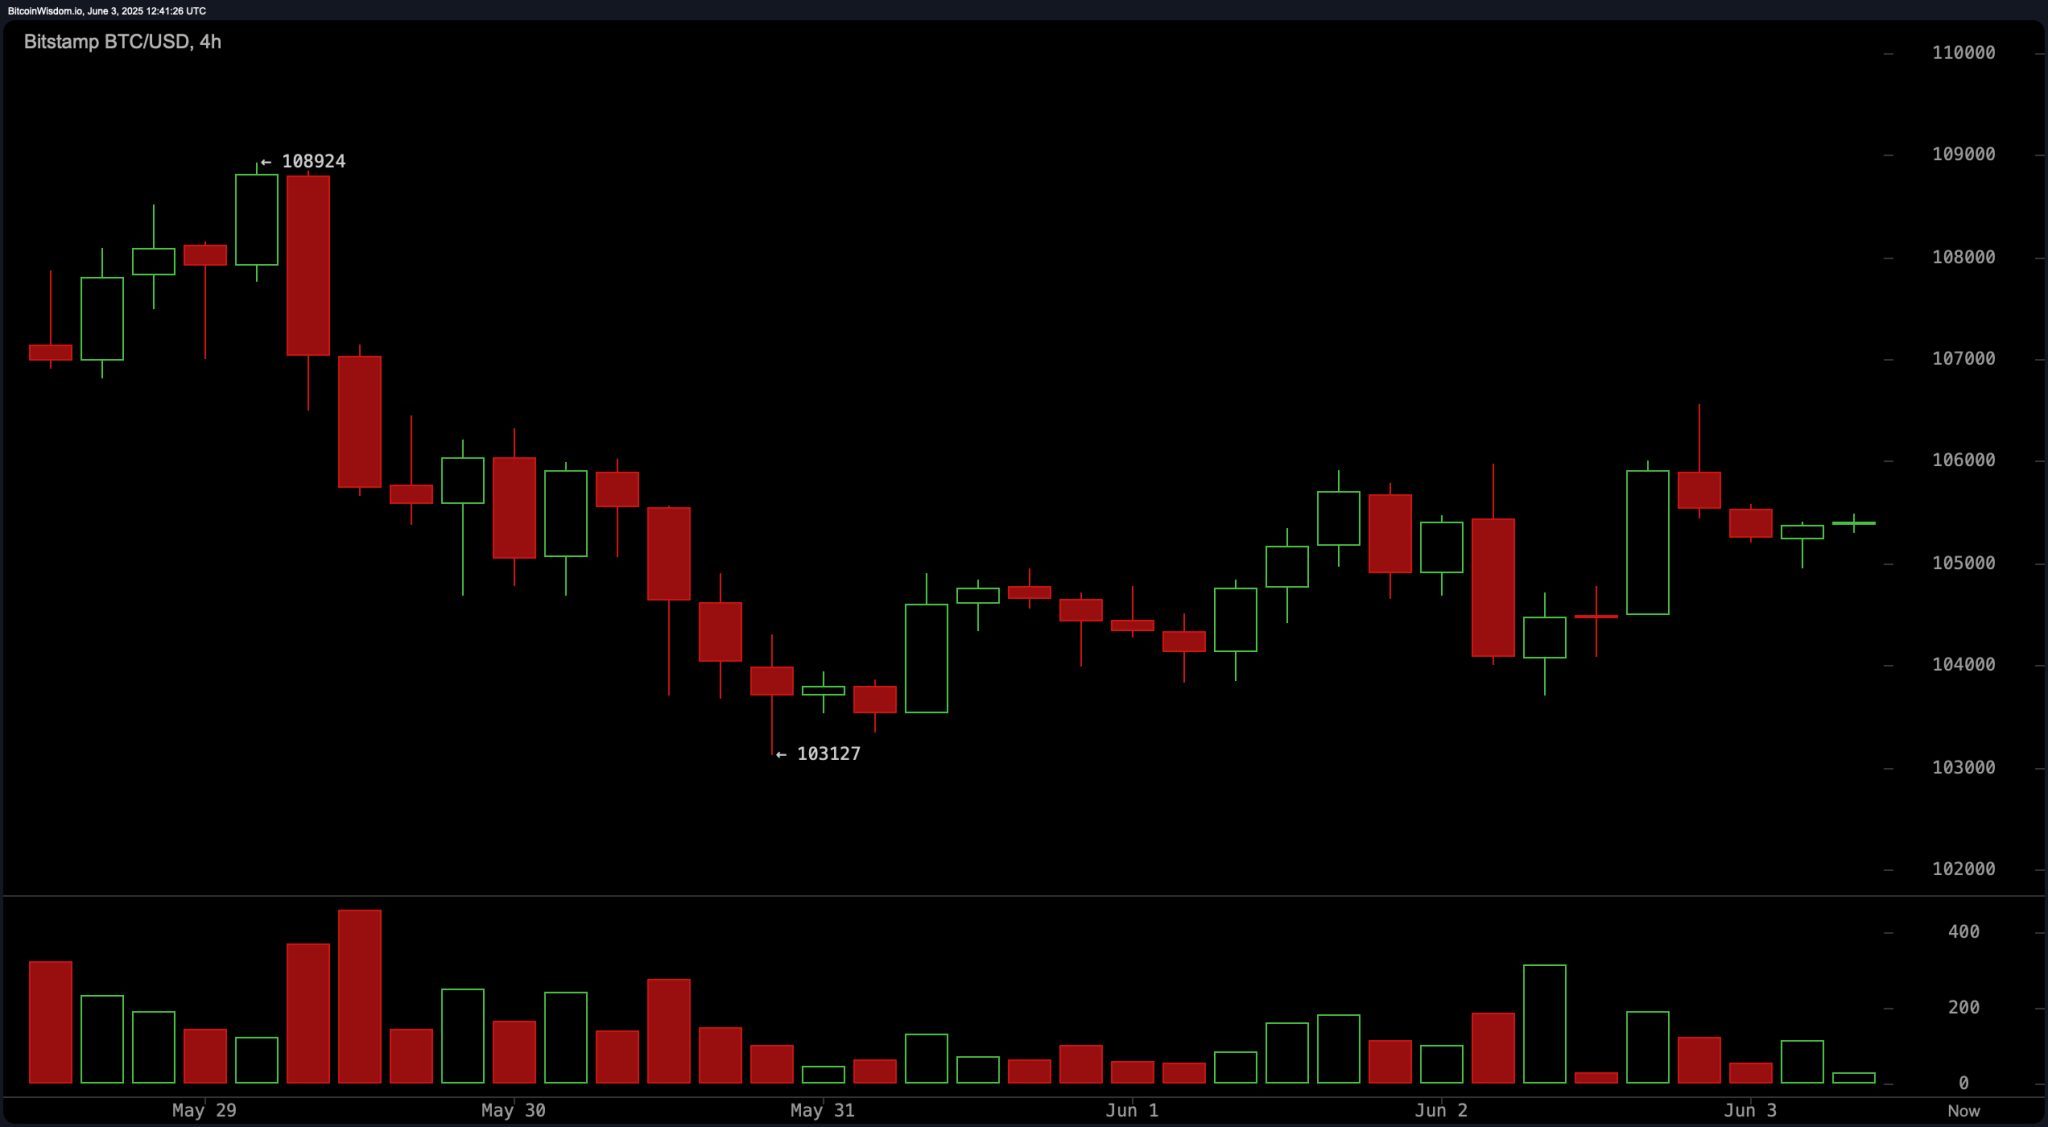
The 4-hour chart supports a cautious stance, with bitcoin showing signs of consolidation between $104,500 and $106,000 following a corrective bounce from a local bottom at $103,127. Despite the bounce, momentum has failed to carry through, reflecting hesitation among traders. A candle close above $106,500 with significant volume could offer a near-term bullish opportunity aiming for $108,000 or higher. Conversely, a breakdown below $104,000 could steer prices toward $102,000. Until either scenario unfolds, the 4-hour structure leans slightly bearish but not decisively so.
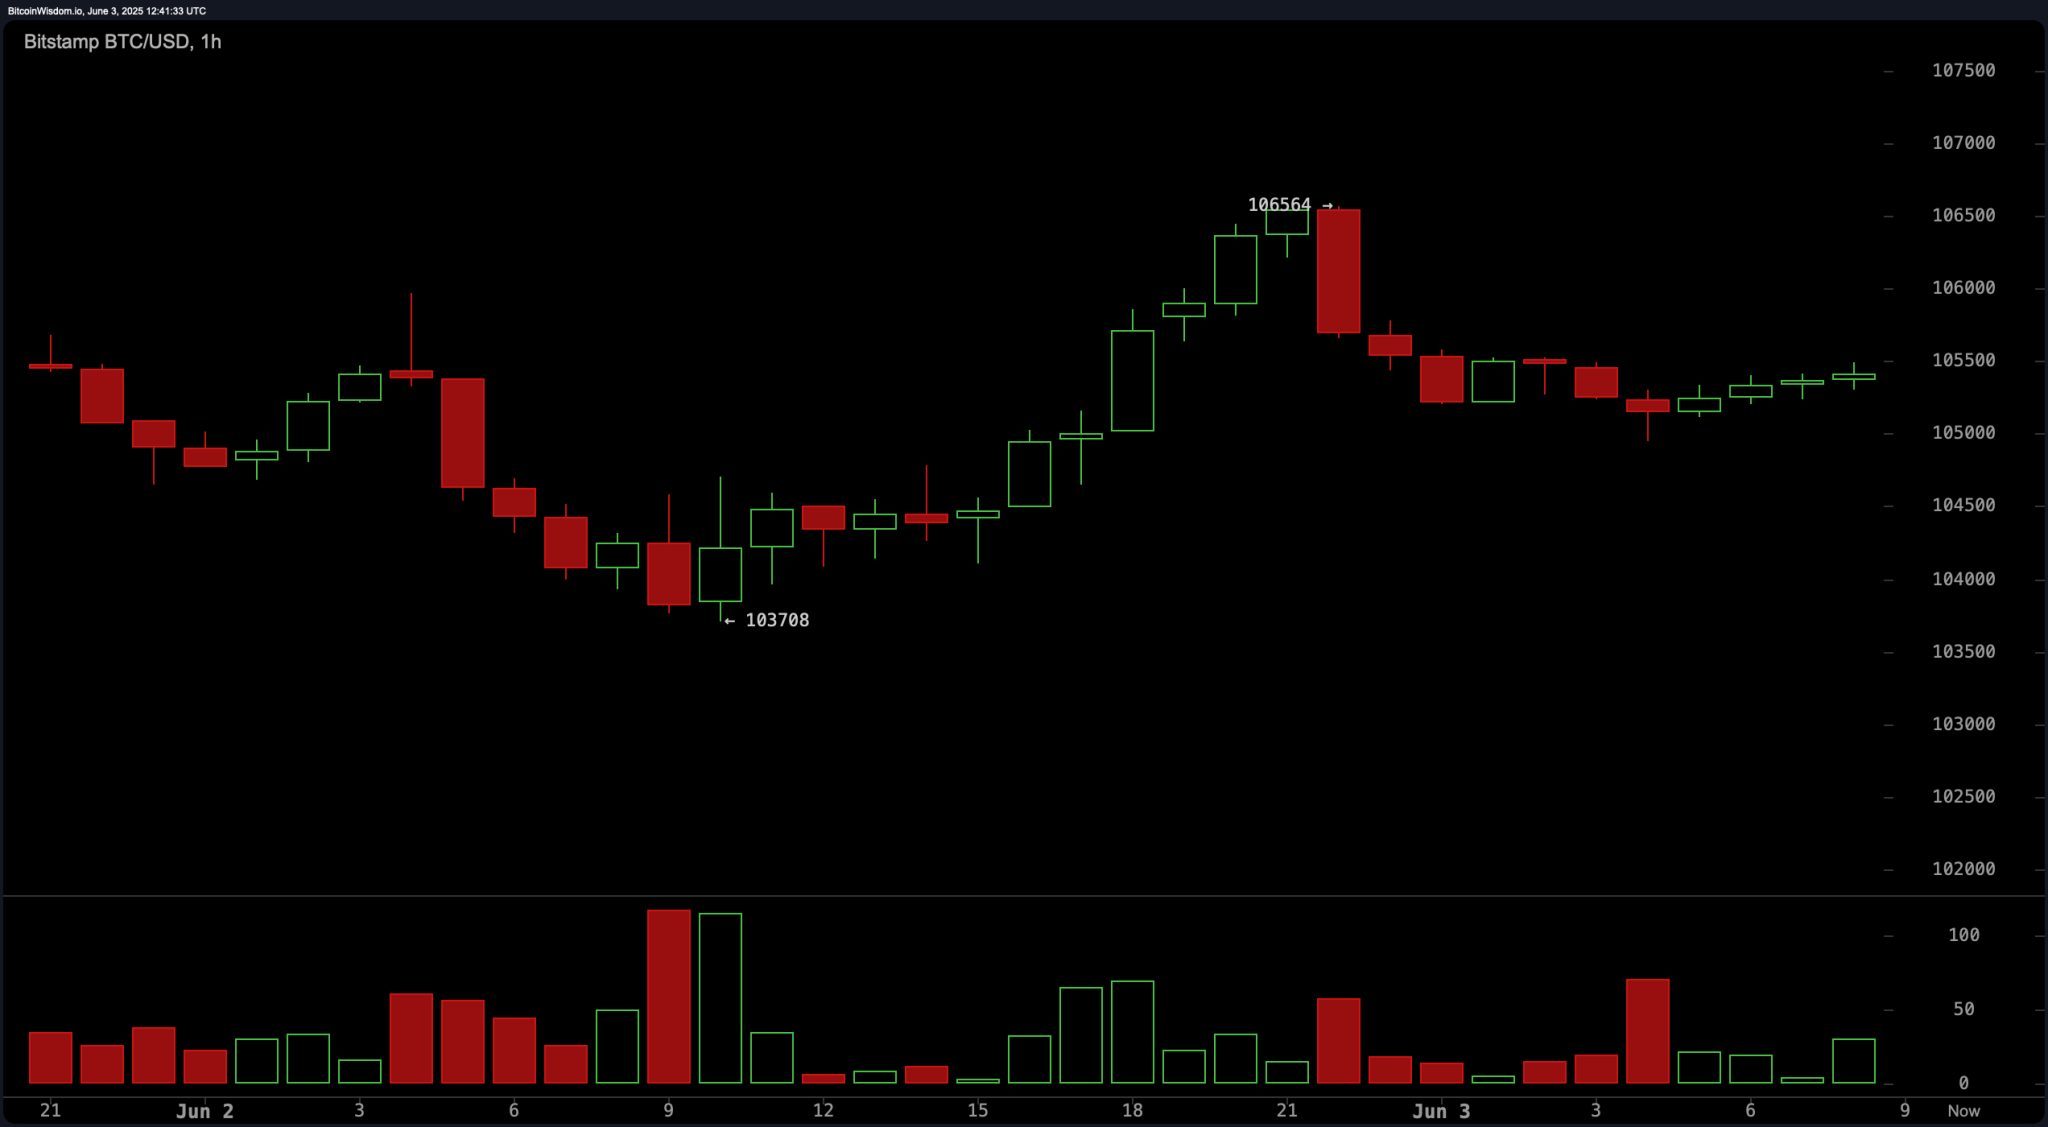
On the 1-hour chart, bitcoin‘s price action illustrates a sharp move to $106,564 followed by a swift retracement, creating a sideways, low-volume phase indicative of market indecision. This lack of conviction presents opportunities for intraday scalps: a potential long position on a bounce from the $105,000 level, or a short if price fails to overcome $106,000. Short-term targets range from $104,000–$104,500 for shorts, and $106,000–$106,300 for longs. Current conditions require tight risk management due to the lack of strong directional cues.
Technical indicators paint a mixed picture. Among oscillators, the relative strength index (RSI) at 53, Stochastic at 31, and commodity channel index (CCI) at -29 all indicate neutrality, suggesting a wait-and-see approach by momentum traders. The average directional index (ADX) at 21 gives a weak bullish signal, while the momentum indicator shows -2,425 and the moving average convergence divergence (MACD) stands at 1,595—both reflecting bearish sentiment. The awesome oscillator is also neutral, indicating a lack of dominant trend strength.
Moving averages (MAs) further reinforce the indecisive nature of the market. Short-term metrics such as the exponential moving average (EMA) and simple moving average (SMA) over 10 and 20 periods show bearish signals, with values hovering above the current price. However, medium- and long-term indicators—EMAs and SMAs over 30, 50, 100, and 200 periods—are bullish, suggesting that the broader trend remains intact. Until a breakout materializes, bitcoin appears trapped in a transitional phase, with traders watching key levels for clarity.
Bull Verdict:
If bitcoin reclaims and holds above the $107,000 level with confirming volume, it could signal the end of the current consolidation and the beginning of a new leg higher toward the $110,000–$112,000 resistance zone. Support from medium- to long-term moving averages, along with waning selling pressure, adds to the bullish case for a potential breakout.
Bear Verdict:
A decisive drop below $103,000, especially on elevated volume, would confirm a continuation of the bearish correction. Weak momentum readings from the momentum indicator and moving average convergence divergence (MACD), combined with short-term moving averages pointing lower, support a scenario in which bitcoin could revisit the $98,000–$100,000 range.