
Bitcoin hovered between $95,977 to $96,169 over the last hour with a market capitalization of $1.90 trillion and a 24-hour trading volume of $29.88 billion. Trading occurred within a tight intraday range between $93,333 and $96,244, as the market showed signs of both upward momentum and cautious consolidation.

Bitcoin
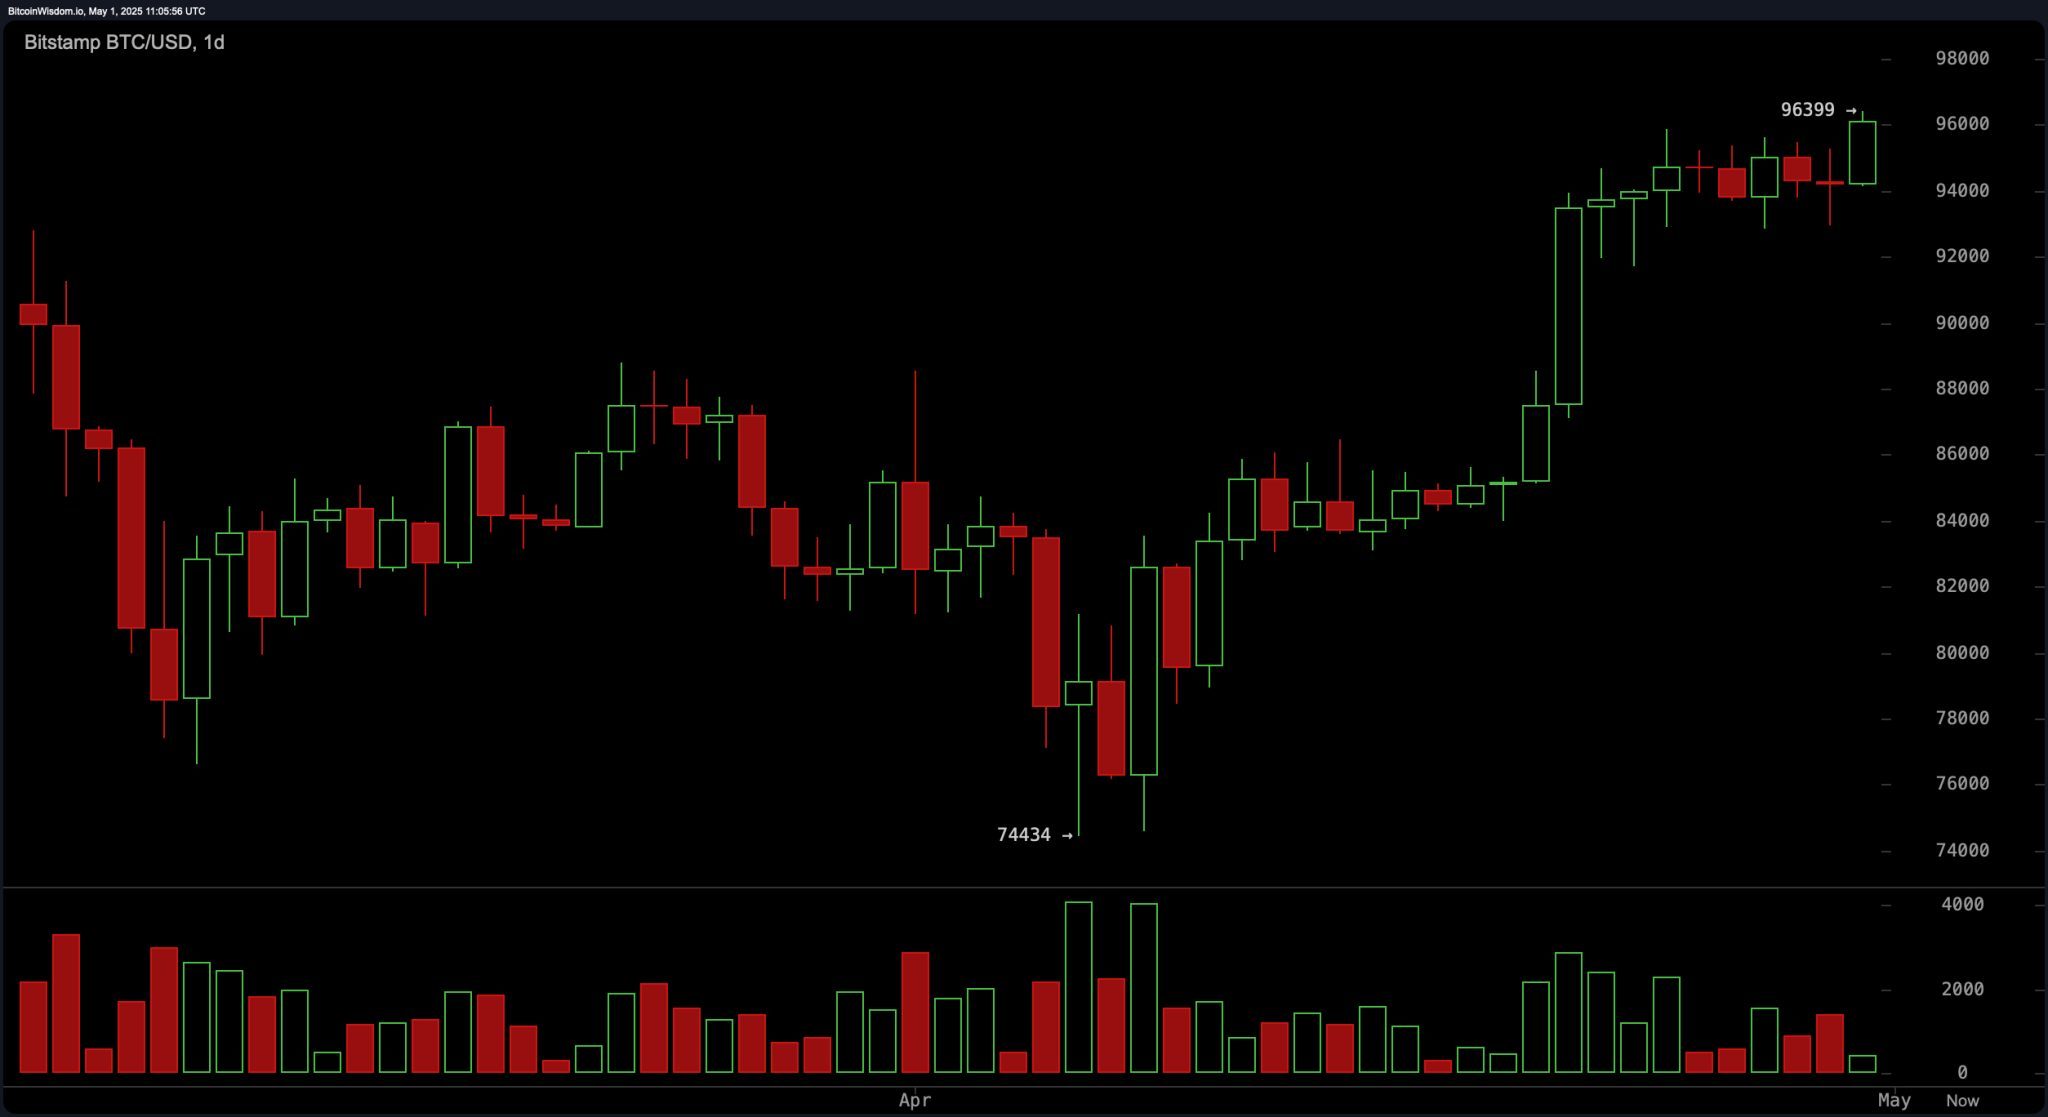
The daily chart indicates a strong bullish momentum initiated in mid-April, pushing bitcoin beyond the consolidation phase marked by a prior low near $74,400. This bullish push has carried prices up toward a psychological resistance band between $96,000 and $97,000. The increasing volume observed on green candles adds credibility to the upward thrust, while major support has been established in the $88,000 to $90,000 region. Any retracement into the $90,000–$92,000 zone, accompanied by renewed volume, could offer an advantageous entry for long positions. However, a break below $88,000 on elevated volume may signify the beginning of a broader correction.
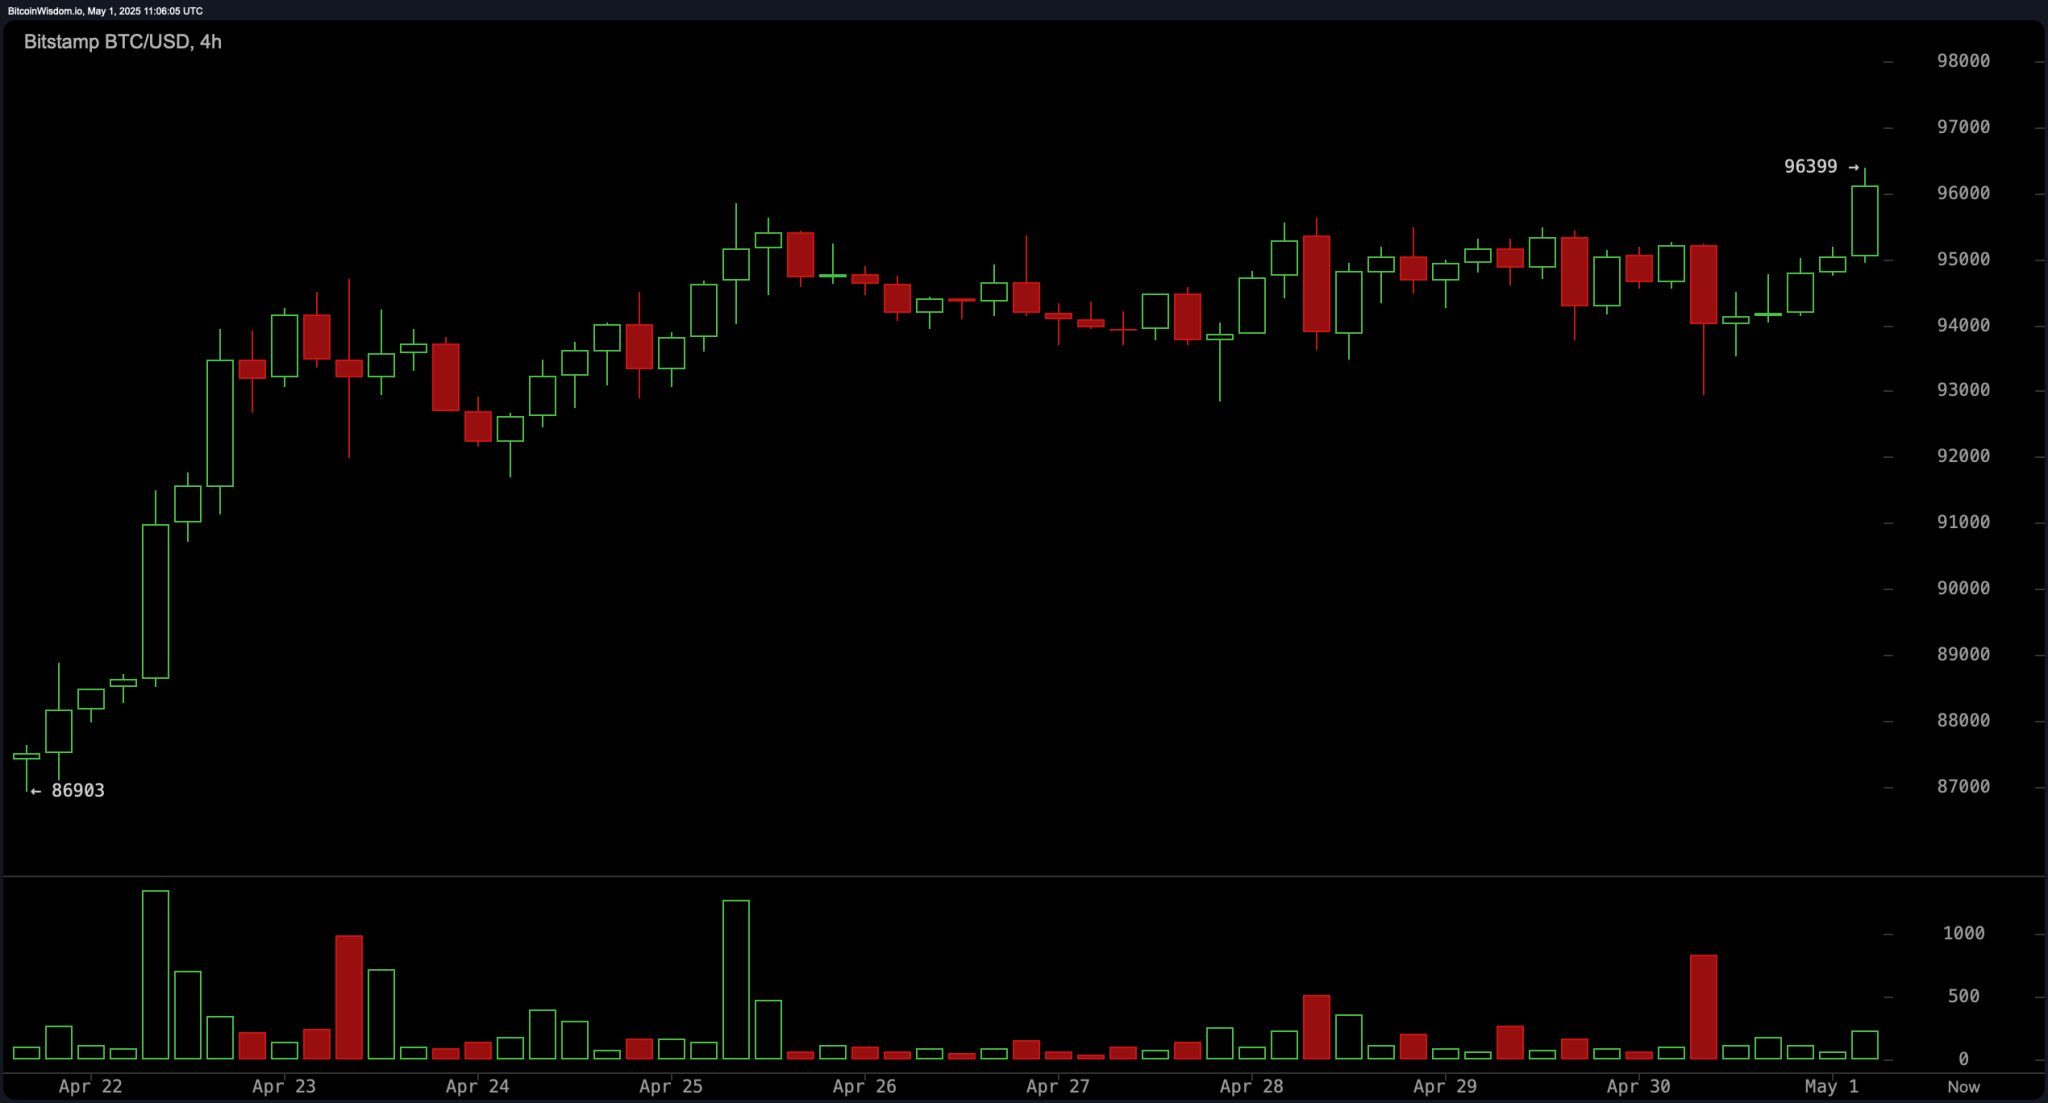
From the 4-hour chart perspective, bitcoin is undergoing a sideways consolidation between $94,000 and $96,000 following a steep rally from approximately $86,000. This range-bound behavior, coupled with declining volume, suggests indecision among traders at current price levels. While minor support is noted at $94,000, a more robust floor exists at $91,500, derived from a previous breakout zone. A breakout above $96,500, validated by a spike in volume, may signal the next leg upward. Conversely, a breakdown below $94,000 on rising sell volume could open the door for a pullback to the $91,500 level.
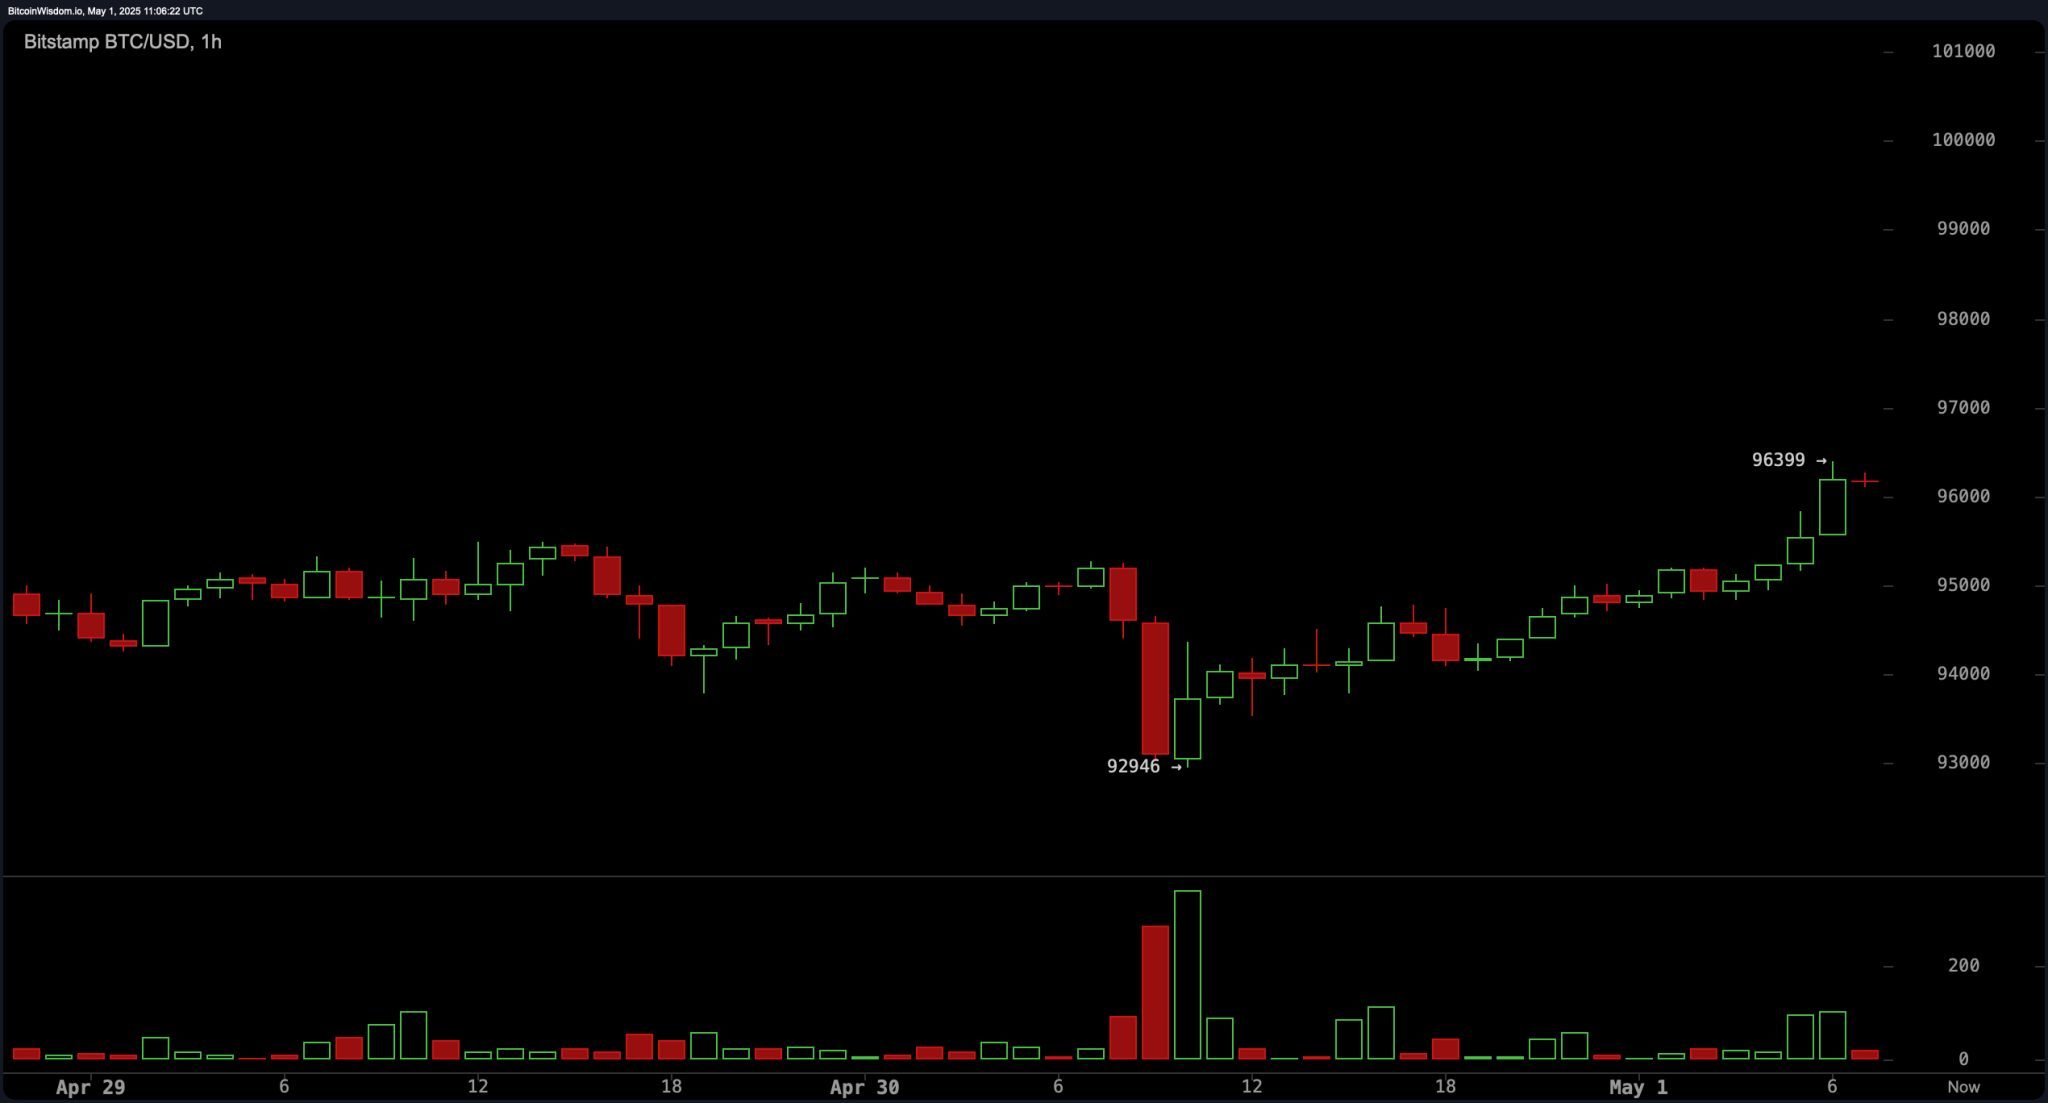
On the hourly chart, the market reveals a recent dip to $92,900, which was swiftly followed by a recovery surge to $96,400—an event marked by a significant spike in volume. Such a move often indicates potential exhaustion, warranting caution. A developing bearish divergence, where price continues to rise on weakening volume, adds to this concern and hints at a possible short-term correction. Intraday traders might look for scalping opportunities on a retest of $95,000, placing tight stop-losses just below $94,500. Profit-taking is advised near the $96,400 to $97,000 range, unless a breakout is confirmed with renewed volume influx.
Oscillators currently present a largely neutral outlook. The relative strength index (RSI) stands at 69, the Stochastic at 91, and the commodity channel index (CCI) at 89—each suggesting the asset is approaching overbought territory without yet crossing critical thresholds. The average directional index (ADX) at 30 confirms a moderate trend strength, while the Awesome oscillator prints at 8,339 with no strong directional cue. Momentum, measured at 8,665, is signaling a sell, implying waning upward velocity. In contrast, the moving average convergence divergence (MACD) level of 3,038 leans bullish with a buy indication.
Moving averages (MAs), across the board, provide robust support to the bullish thesis. Both short- and long-term indicators favor upward momentum: the 10-period exponential moving average (EMA) and simple moving average (SMA) are at $93,359 and $94,406, respectively, and all the way through to the 200-period EMA and SMA at $85,926 and $89,843, each gives a buy signal. These trends illustrate a strong foundational support system, minimizing the likelihood of a sharp reversal barring external shocks or fundamental disruptions.
Bull Verdict:
Bitcoin remains in a well-supported uptrend across all major timeframes, with consistent buy signals from all moving averages and bullish momentum on the daily chart. While oscillators suggest a slightly overheated market, the structure remains favorable for further gains, particularly on a breakout above $96,500 backed by volume. As long as the price holds above key support levels near $91,500, the bulls retain control.
Bear Verdict:
Despite strong upward movement, signs of exhaustion on lower timeframes and weakening momentum warn of a potential short-term correction. Oscillators are nearing overbought territory, and a failure to decisively clear the $96,500 resistance could lead to a retracement toward the $91,500–$90,000 support band. A break below $88,000 on volume would shift sentiment sharply bearish, signaling a possible trend reversal.