
On May 24, 2025, bitcoin ( BTC) is coasting along at $109,273, reflecting a substantial valuation amid an active trading session. With a market capitalization of $2.17 trillion and a 24-hour trading volume of $46.66 billion, the price oscillated between an intraday low of $107,156 and a peak of $109,840.

Bitcoin
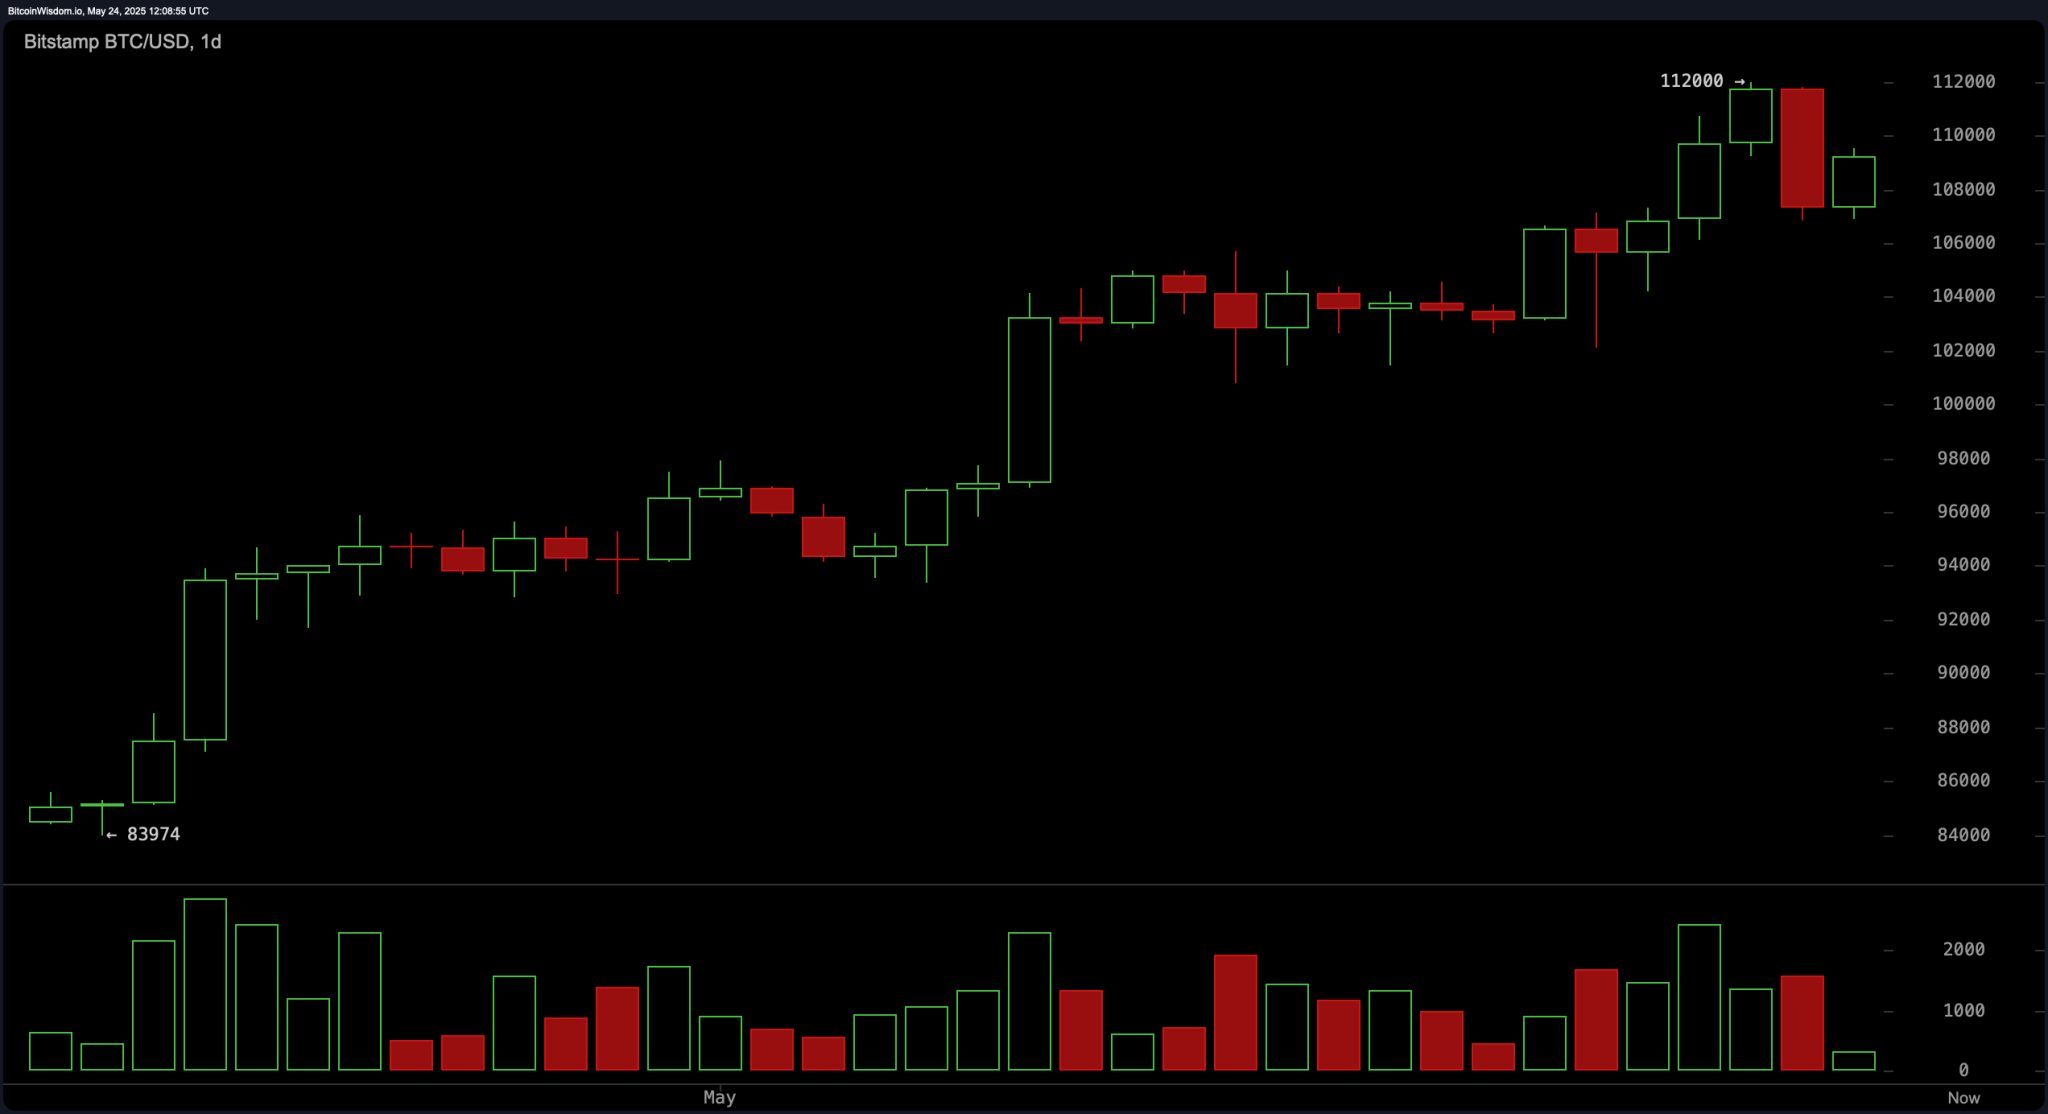
On the daily chart, bitcoin (BTC) is in a bullish trend, despite a recent retracement from a local high of $112,000. The support zone near $98,000–$100,000 remains critical, backed by historical demand earlier in the month. Resistance is clearly defined at $112,000, a level where significant selling pressure emerged. While green candles earlier in the rally were supported by volume, the red candle at the top signifies caution. If bitcoin holds above the $106,000–$107,000 range and prints a bullish engulfing candle, traders may view this as a strategic entry point, while exhaustion signals near $112,000 would warrant exits.
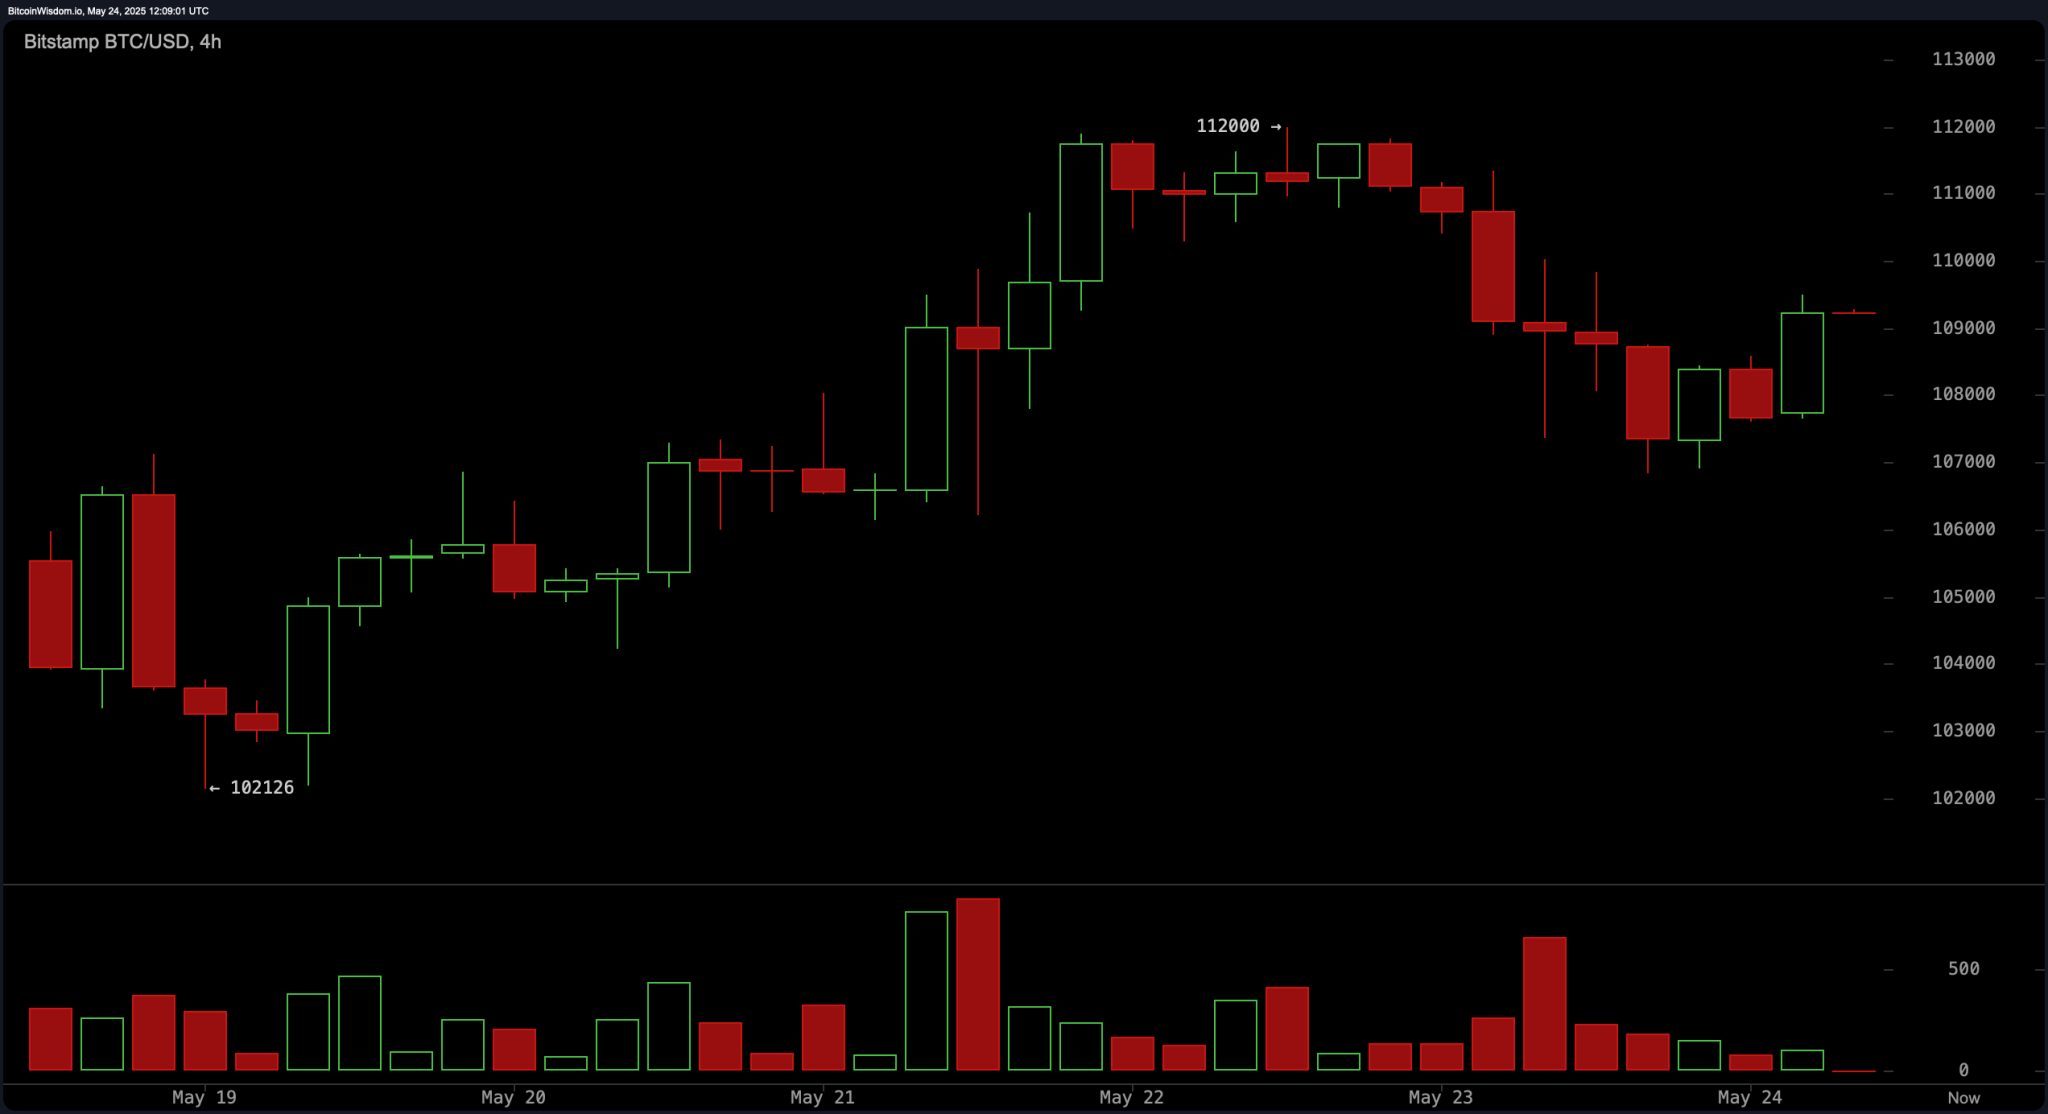
The 4-hour chart presents a local correction narrative, tracing a descending channel after peaking at $112,000. A recovery to over $109,000 signals potential reversal, albeit with subdued volume following a prior panic-driven decline. The technical pattern hints at an upside break should bitcoin close above $110,000 with confirmation by volume. Conversely, a drop below the $108,000 threshold with reinforced bearish volume could indicate a return to the $106,000 level, reintroducing caution into the market.
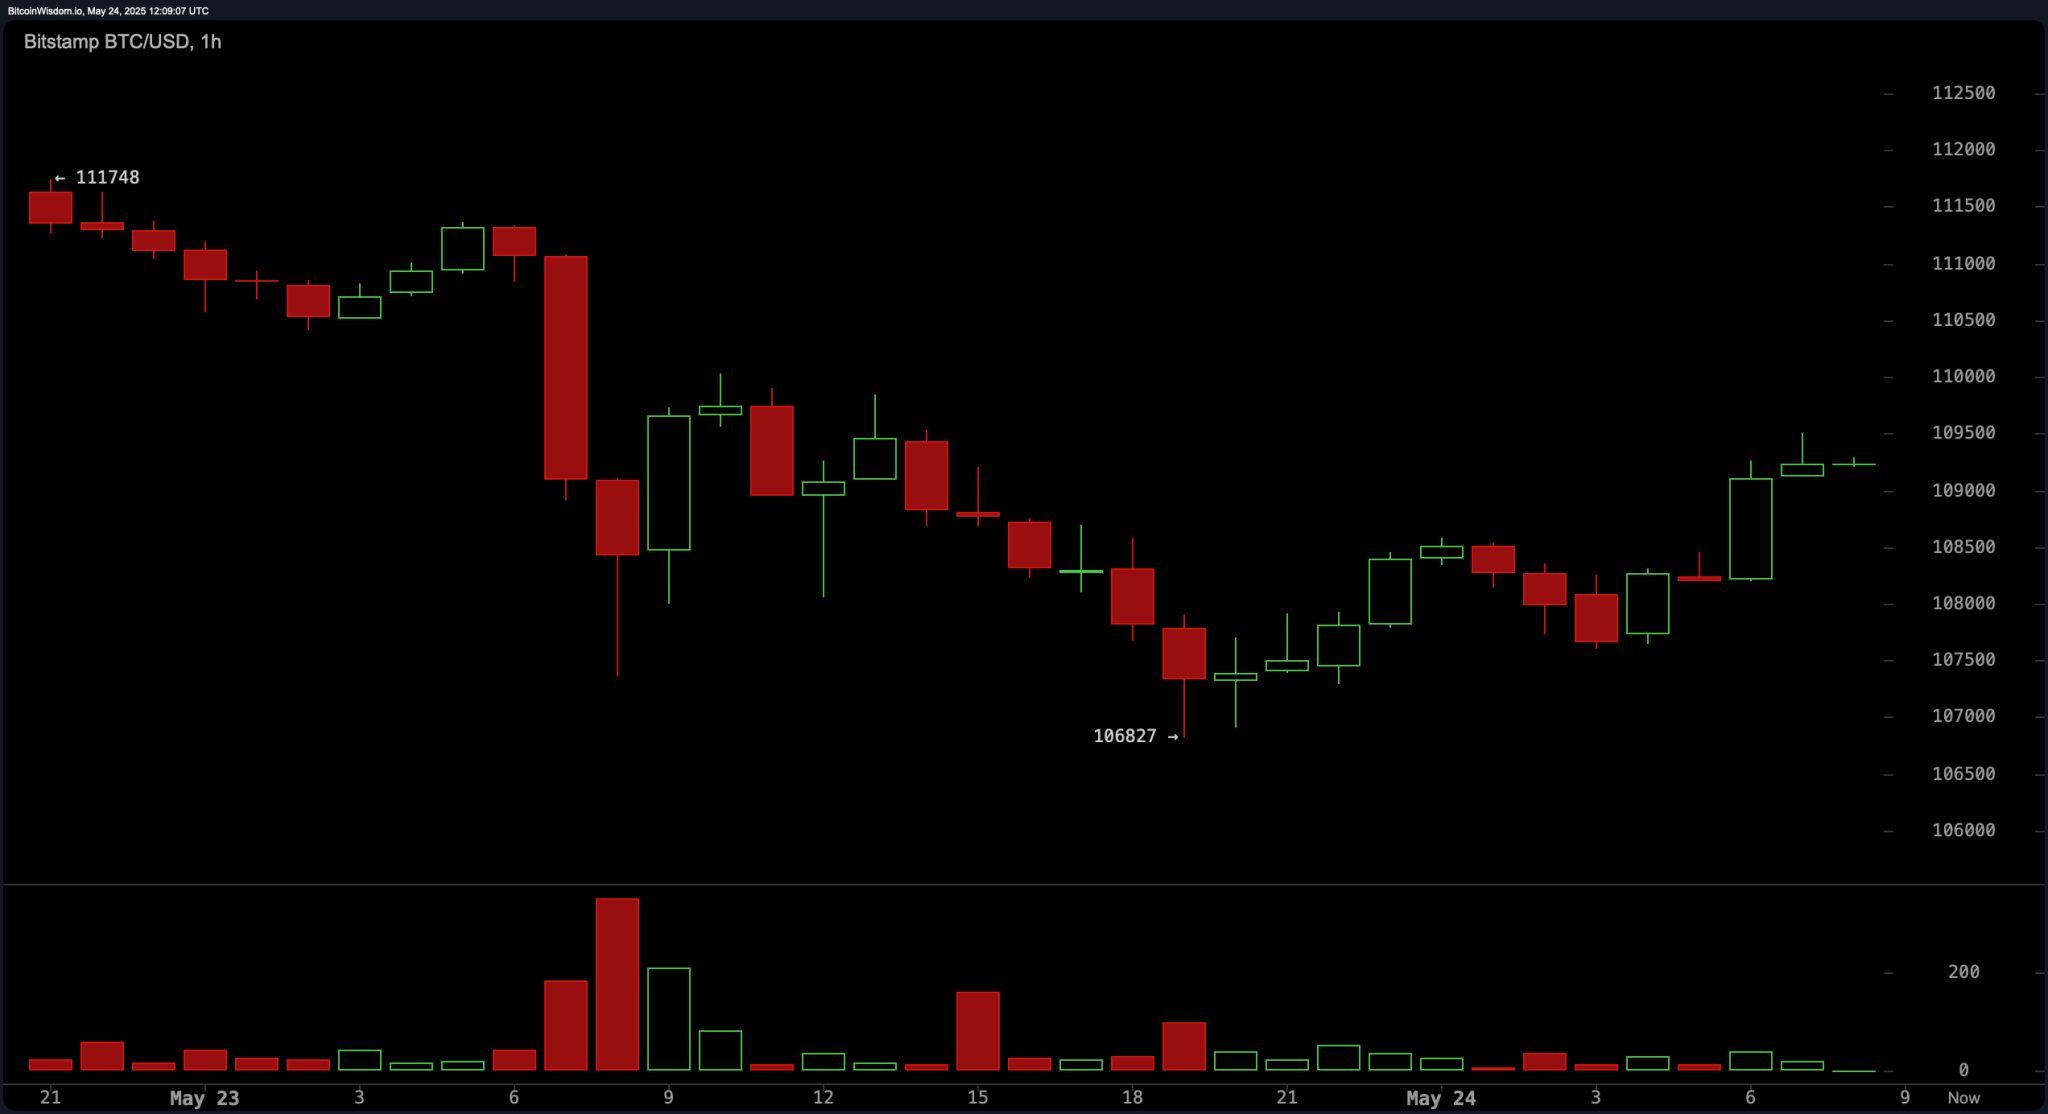
Short-term price action on the 1-hour chart displays a rapid decline from $111,748 to $106,827, followed by a gradual rebound. An emerging inverse head and shoulders pattern, characterized by the formation of the right shoulder, supports a bullish near-term outlook. Breakout confirmation lies between $109,500 and $110,000. Should bitcoin fall and close below $108,000 with notable sell-side activity, this would invalidate the reversal premise and suggest renewed bearish momentum.
Oscillator readings are mixed, suggesting a market in equilibrium. The relative strength index (RSI) at 66, Stochastic at 77, and average directional index (ADX) at 33 all signal neutrality. However, the momentum oscillator at 5,747 and the moving average convergence divergence (MACD) at 4,016 indicate bullish bias, while the commodity channel index (CCI) at 113 flashes a sell signal, implying overbought conditions. The Awesome oscillator corroborates the broader neutral sentiment.
Moving averages paint a strongly bullish backdrop. All short- to long-term exponential moving averages (EMAs) and simple moving averages (SMAs)—ranging from the 10-period EMA at $107,056 to the 200-period EMA at $89,495—are signaling positive conditions. This alignment suggests that despite short-term corrections, the overall trend remains upward. The confluence of bullish signals across multiple timeframes affirms investor confidence and positions bitcoin for further gains if key resistance levels are broken with strong confirmation.
Bull Verdict:
Bitcoin’s price action remains underpinned by strong technical support and consistent buy signals across all major moving averages. If it breaks above $110,000 with volume confirmation, the stage is set for a renewed push toward and potentially beyond the $112,000 resistance. The broader trend is bullish, and momentum indicators suggest upside continuation.
Bear Verdict:
Despite a prevailing bullish structure, caution is warranted. A failure to maintain support above $108,000, especially with increasing sell volume, could trigger a deeper pullback toward $106,000 or lower. Mixed oscillator signals and overhead resistance at $112,000 reinforce the risk of short-term exhaustion and reversal.