
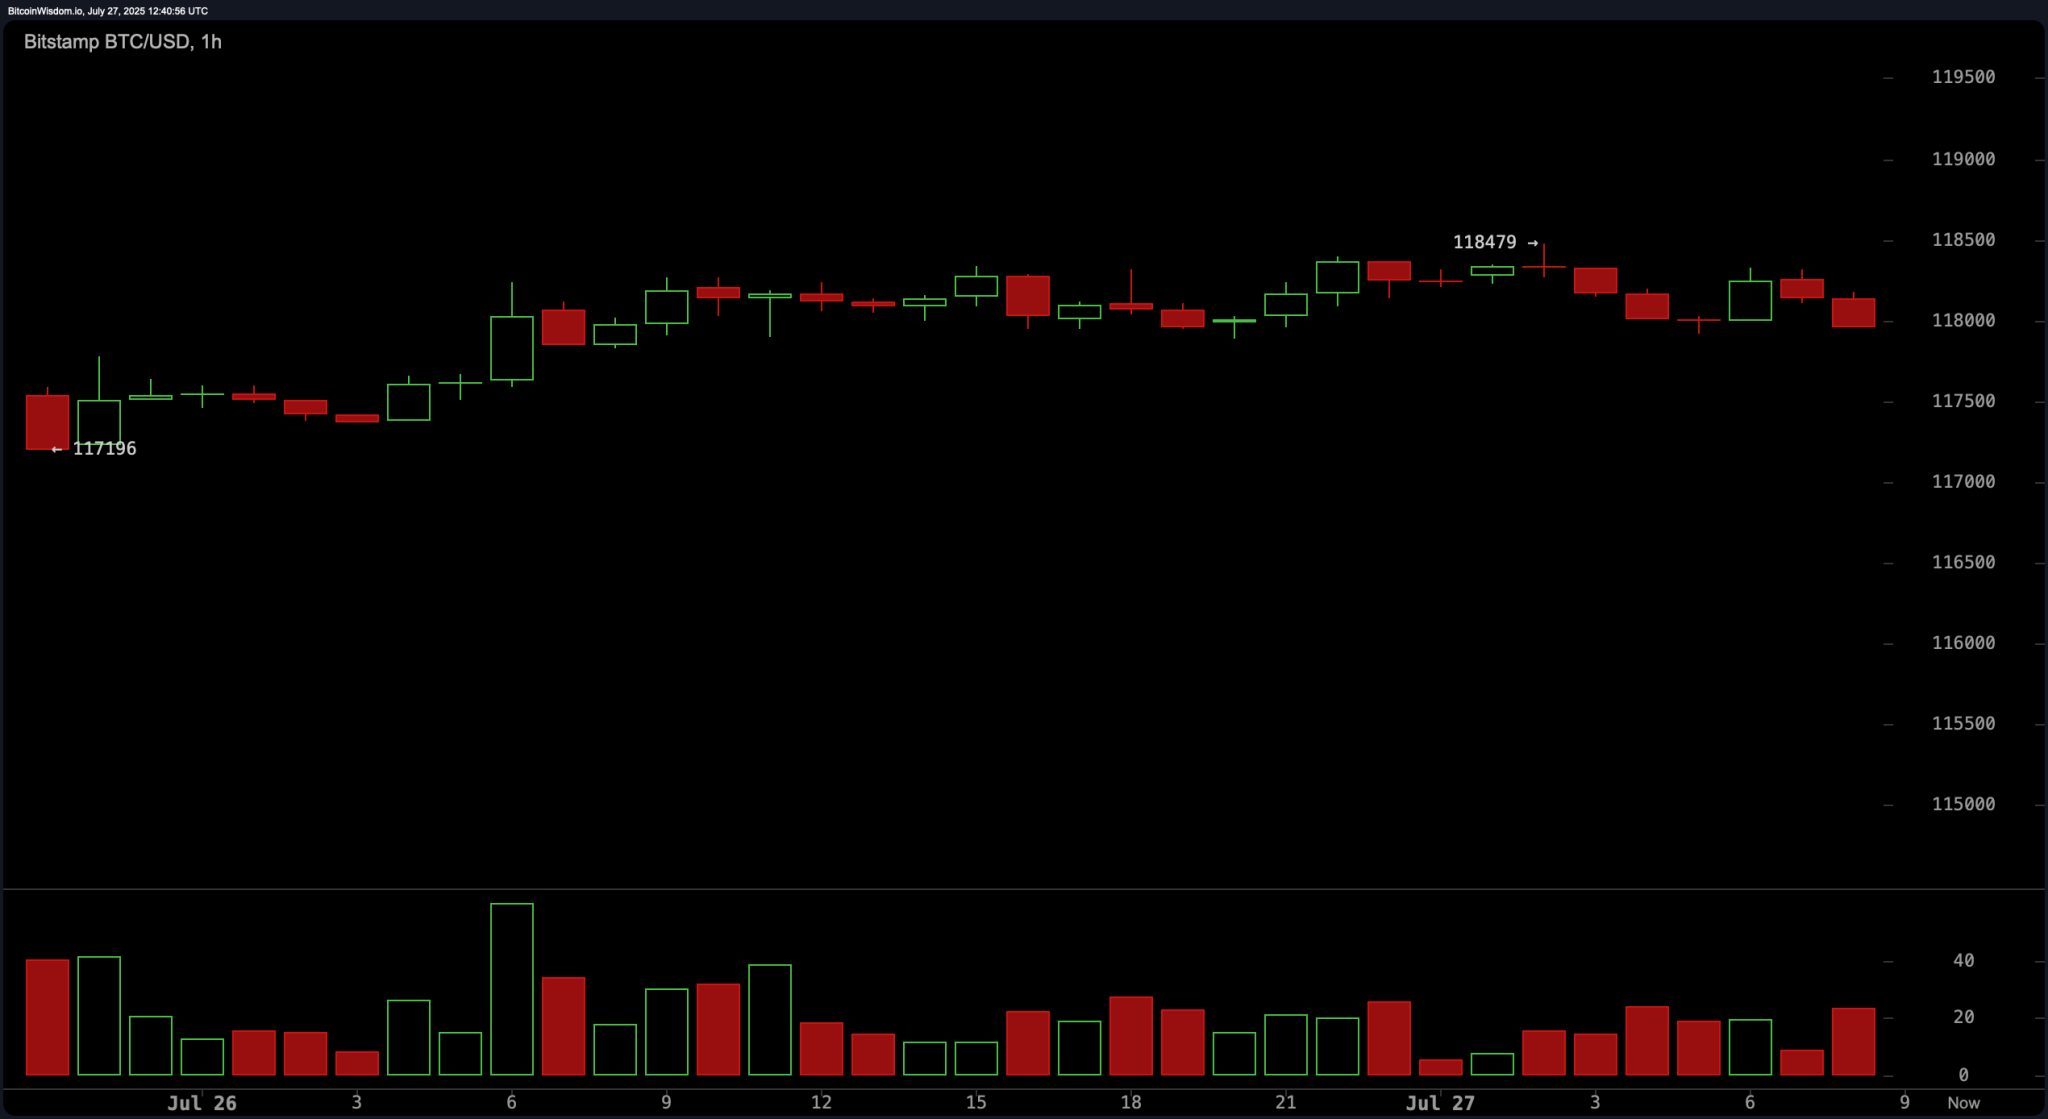
Bitcoin’s price traded between $117,922 and $118,020 over the last 60 minutes, indicating minimal price volatility in the short term. With a market capitalization of $2.34 trillion and a 24-hour trading volume of $22.32 billion, bitcoin maintained an intraday range between $117,196 and $118,479, reflecting tight consolidation near recent highs.

Bitcoin
Bitcoin’s 1-hour chart shows a pronounced consolidation pattern, trading in a narrow range from approximately $117,200 to $118,500. Volume on this timeframe has been gradually decreasing, suggesting a lack of strong conviction among traders. This behavior is often associated with accumulation or distribution, where market participants await a clearer directional move. A breakout above $118,500, if accompanied by volume, may provide a short-term bullish signal, while a break below $117,000 could trigger a quick sell-off. Due to the choppy environment, stop-losses should remain tight, ideally within a $200–$300 band.
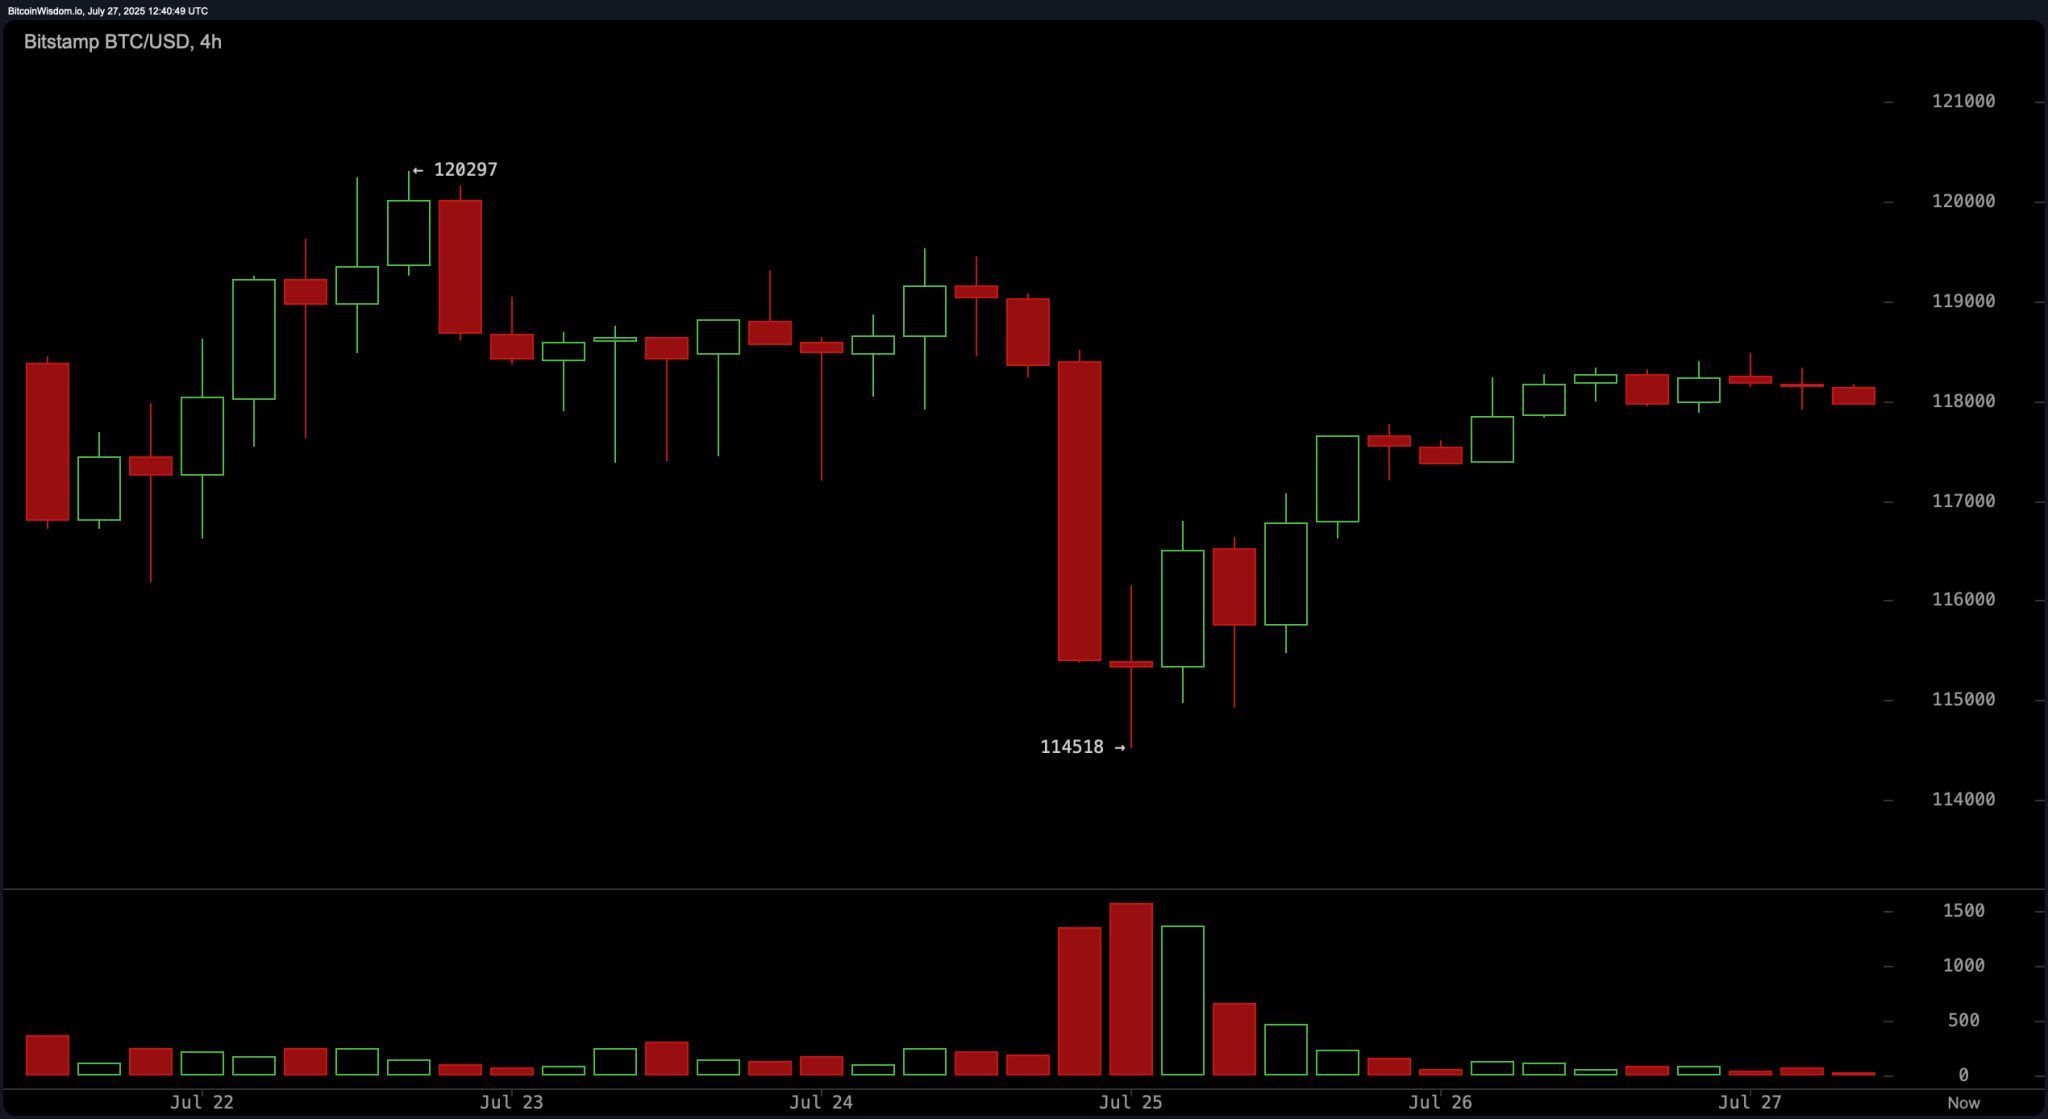
The 4-hour bitcoin chart highlights a recent dip from around $120,297 to $114,518, followed by a recovery that lacks significant momentum. The structure resembles a possible bullish flag; however, the diminished buy volume and failure to reclaim $119,000 raise caution. A sustained move above $119,000 is necessary to confirm bullish continuation, while a break back below $117,000 could resume downward pressure.
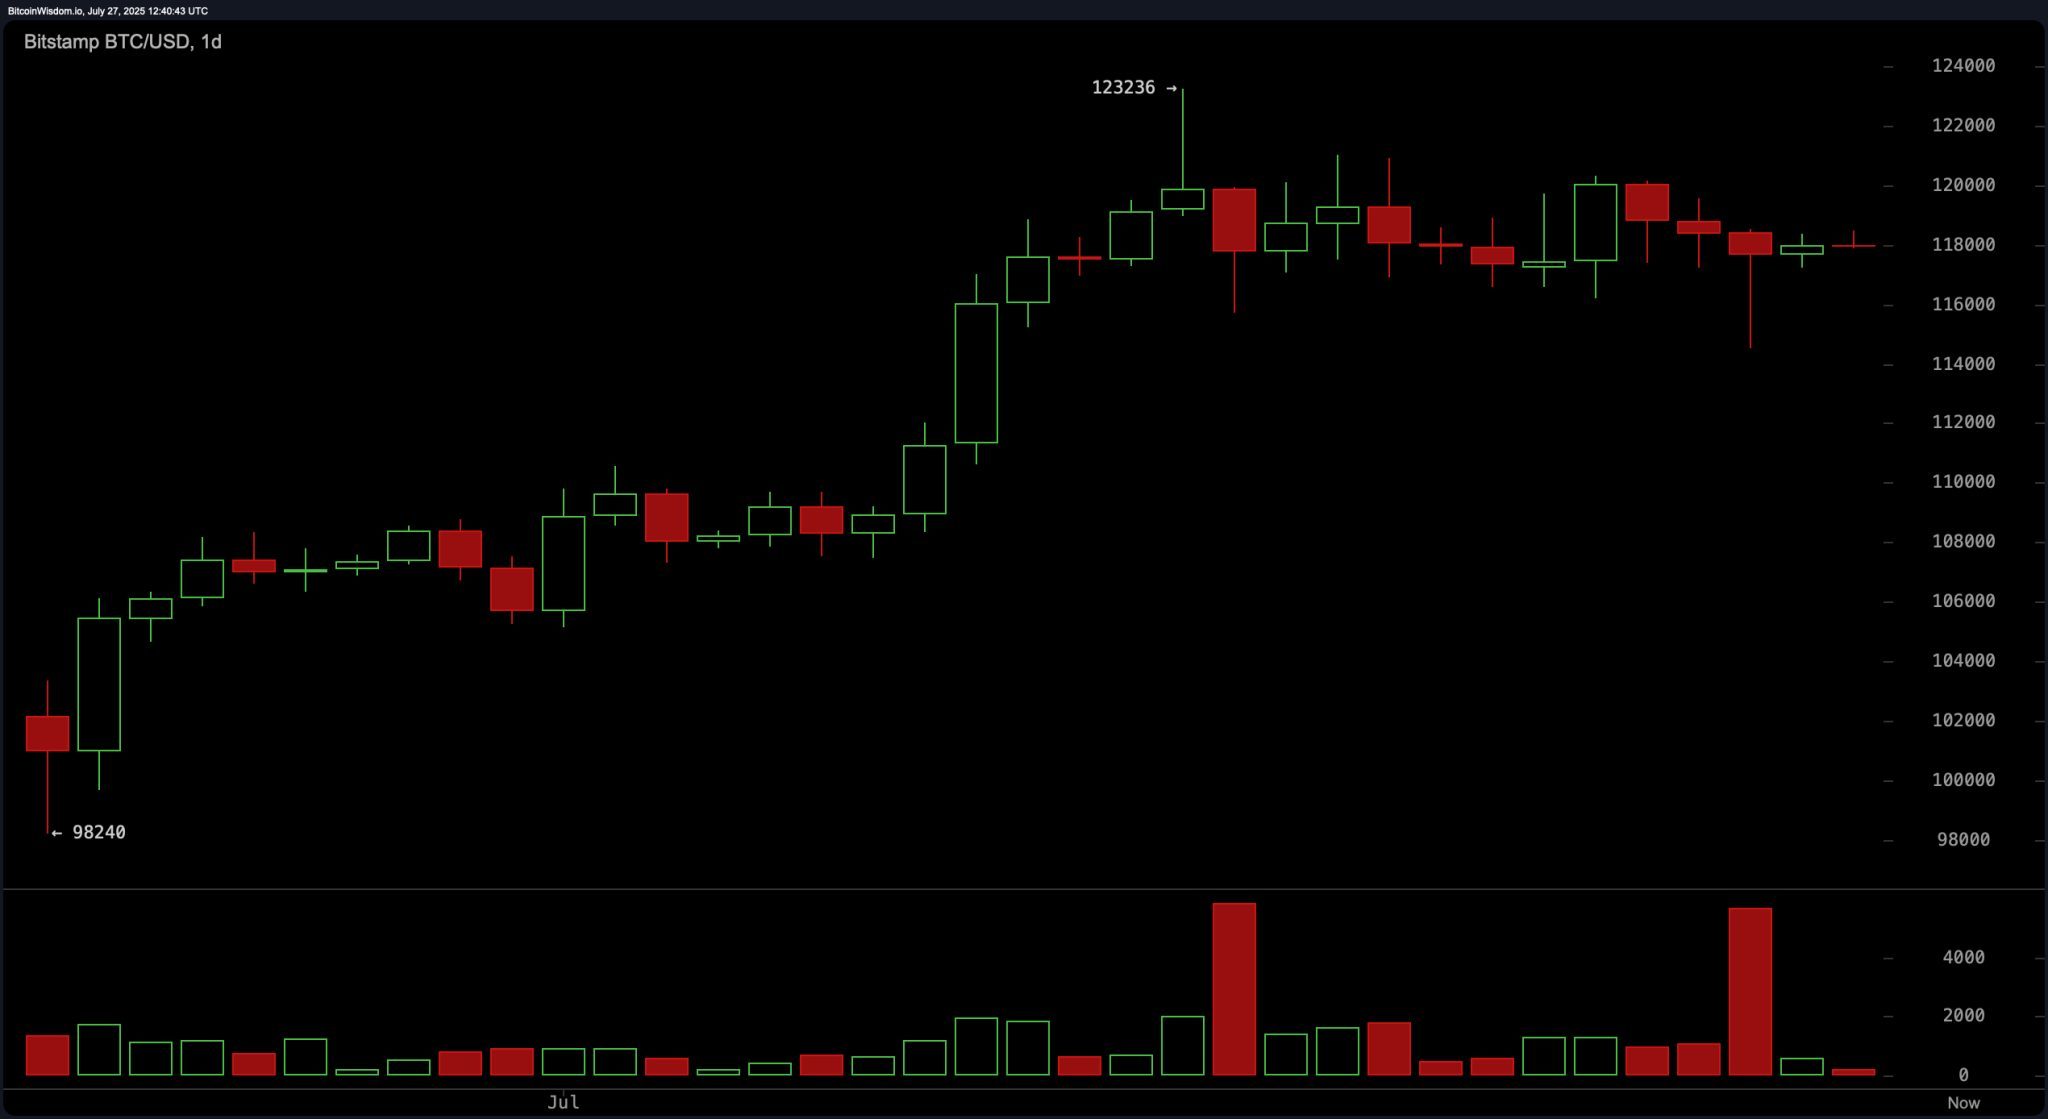
Daily chart analysis points to bitcoin’s larger trend, marked by an uptrend from approximately $98,240 to a peak of $123,236. Currently, the market is consolidating between $117,000 and $120,000, indicating a pause in momentum. A notable red volume spike at the peak implies possible profit-taking by institutional players. Immediate resistance remains at $123,000, while key support lies within the $114,000–$116,000 range. A clean breakout above $123,500 with volume would validate a new leg higher, whereas failure to hold above $114,000 would invalidate the bullish setup.
Oscillator readings support a neutral-to-cautious outlook. The relative strength index (RSI) sits at 60, the Stochastic at 38, the commodity channel index (CCI) at 33, the average directional index (ADX) at 26, and the Awesome oscillator at 4,678—all indicating neutral conditions. However, both the momentum indicator (-1,290) and the moving average convergence divergence (MACD) level (2,217) suggest bearish divergence, signaling potential downside pressure in the near term.
Moving averages (MAs) provide a mixed signal across timeframes. While the 10-period exponential moving average (EMA) at 117,927 is bullish, the 10-period simple moving average (SMA) at 118,147 signals bearish divergence. Other short- and mid-term averages, such as the 20, 30, 50, 100, and 200-period EMAs and SMAs, all maintain a bullish stance, reinforcing underlying strength. These moving averages serve as dynamic support levels, especially near the $114,000–$116,000 zone, which remains a critical area for bullish traders to defend.
Bull Verdict:
Bitcoin’s consolidation above the $117,000 level, combined with strong support from the 20 to 200-period moving averages, suggests that the broader uptrend remains intact. If buyers reclaim $119,000 and volume returns, a breakout toward the $123,000 resistance is likely, paving the way for further upside continuation.
Bear Verdict:
Despite bitcoin’s broader uptrend, the current lack of momentum, neutral oscillator readings, and selling signals from the momentum and MACD indicators introduce downside risks. Failure to hold above $117,000 could open the door to a deeper retracement toward the $114,000–$116,000 support zone or even lower if selling pressure escalates.