
Bitcoin, currently valued at $107,075 to $107,748 over the last hour, has a market capitalization of $2.12 trillion and a 24-hour trading volume of $118.01 billion. It navigated a session marked by pronounced volatility. The cryptocurrency’s intraday price fluctuated between $99,462 and $109,356, reflecting a dynamic response to market conditions as Donald Trump assumes the presidency.

Bitcoin
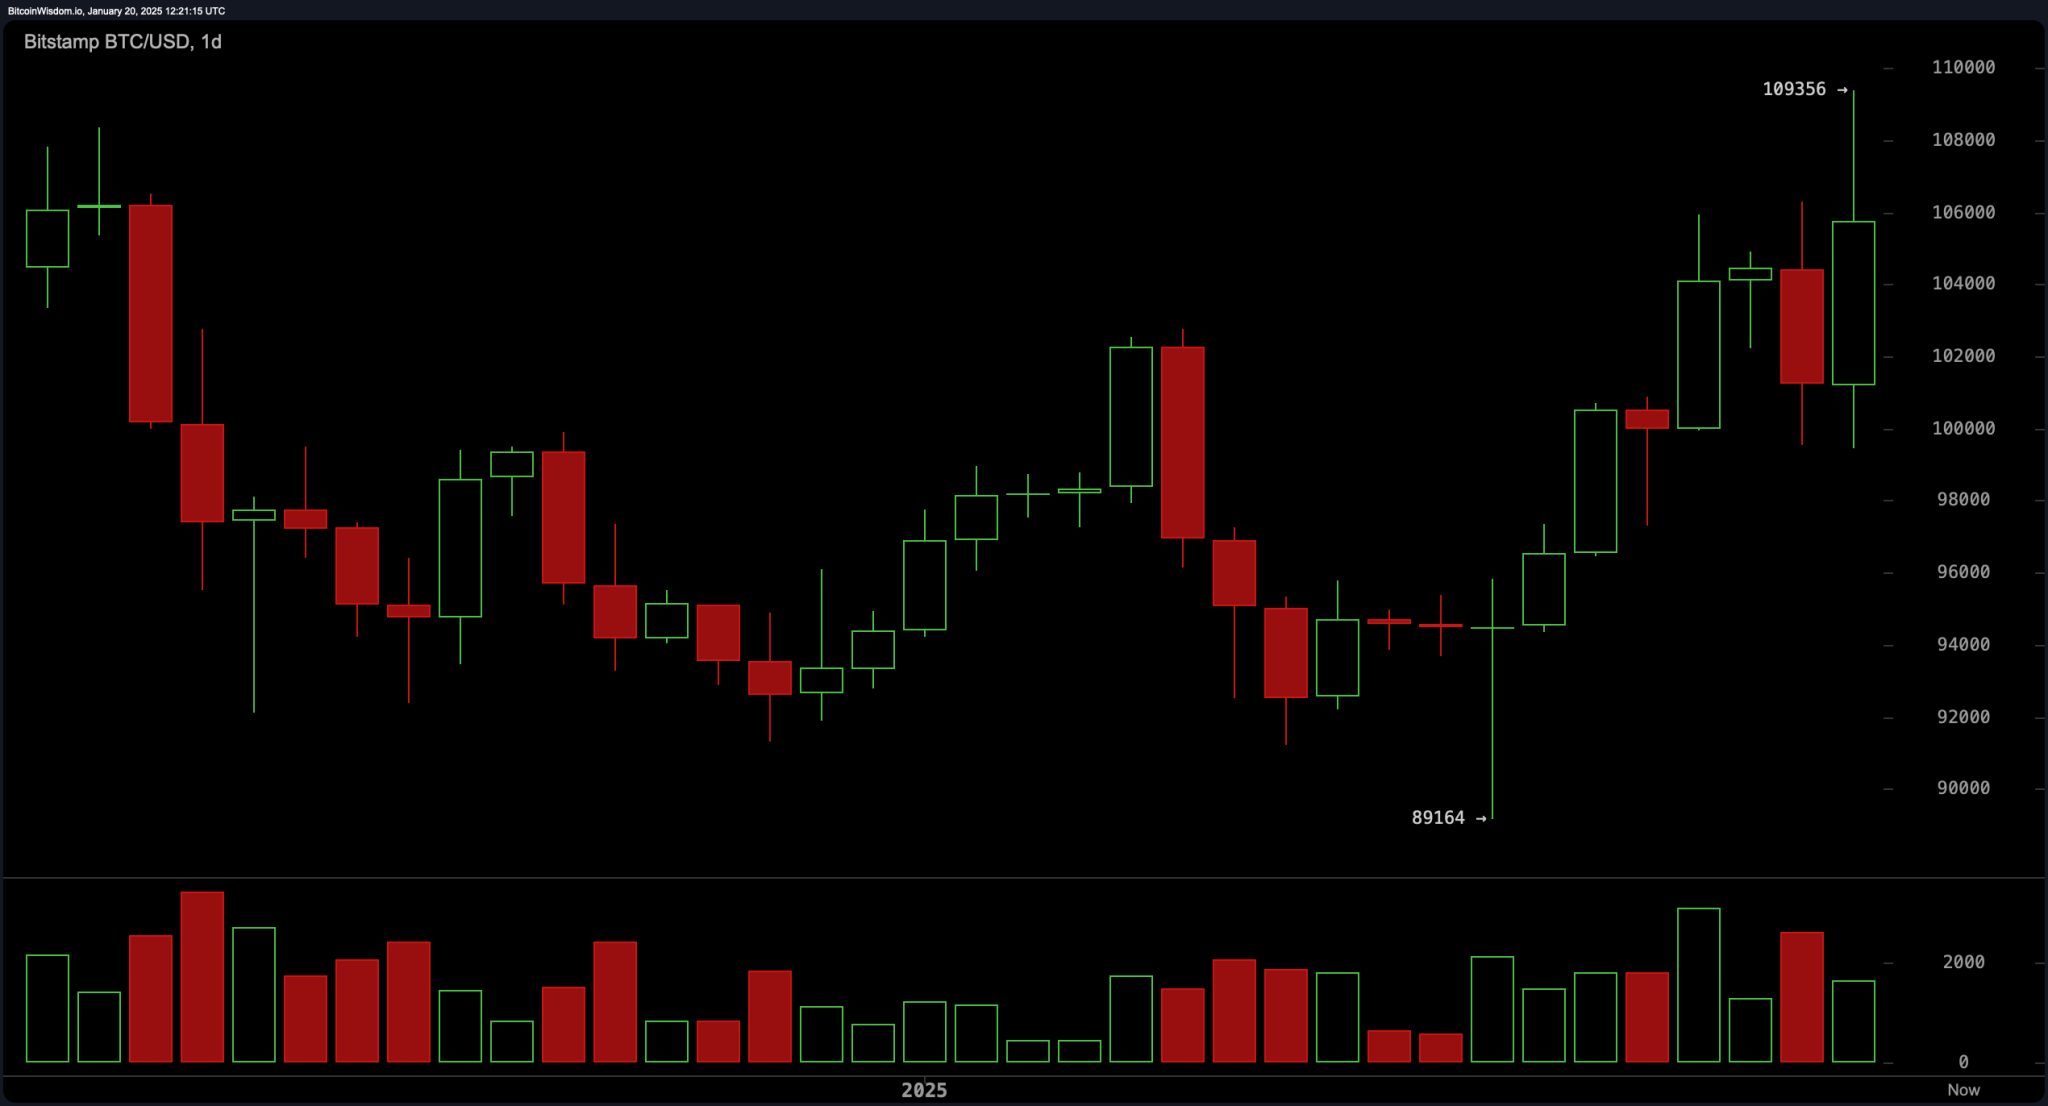
Analysis of the daily chart reveals that bitcoin reached a high of $109,356 before succumbing to intense selling pressure, resulting in the formation of a substantial downturn near this resistance threshold. Key support emerges in the $94,000–$95,000 range, a zone previously characterized by price consolidations and rejection wicks. The heightened trading volume during the ascent signals strong market participation; however, the subsequent downturn suggests either profit-taking or the potential for trend reversal. Market participants are advised to await clearer signals, such as a rebound from $95,000 or a breakout above $109,000, to confirm directional bias.
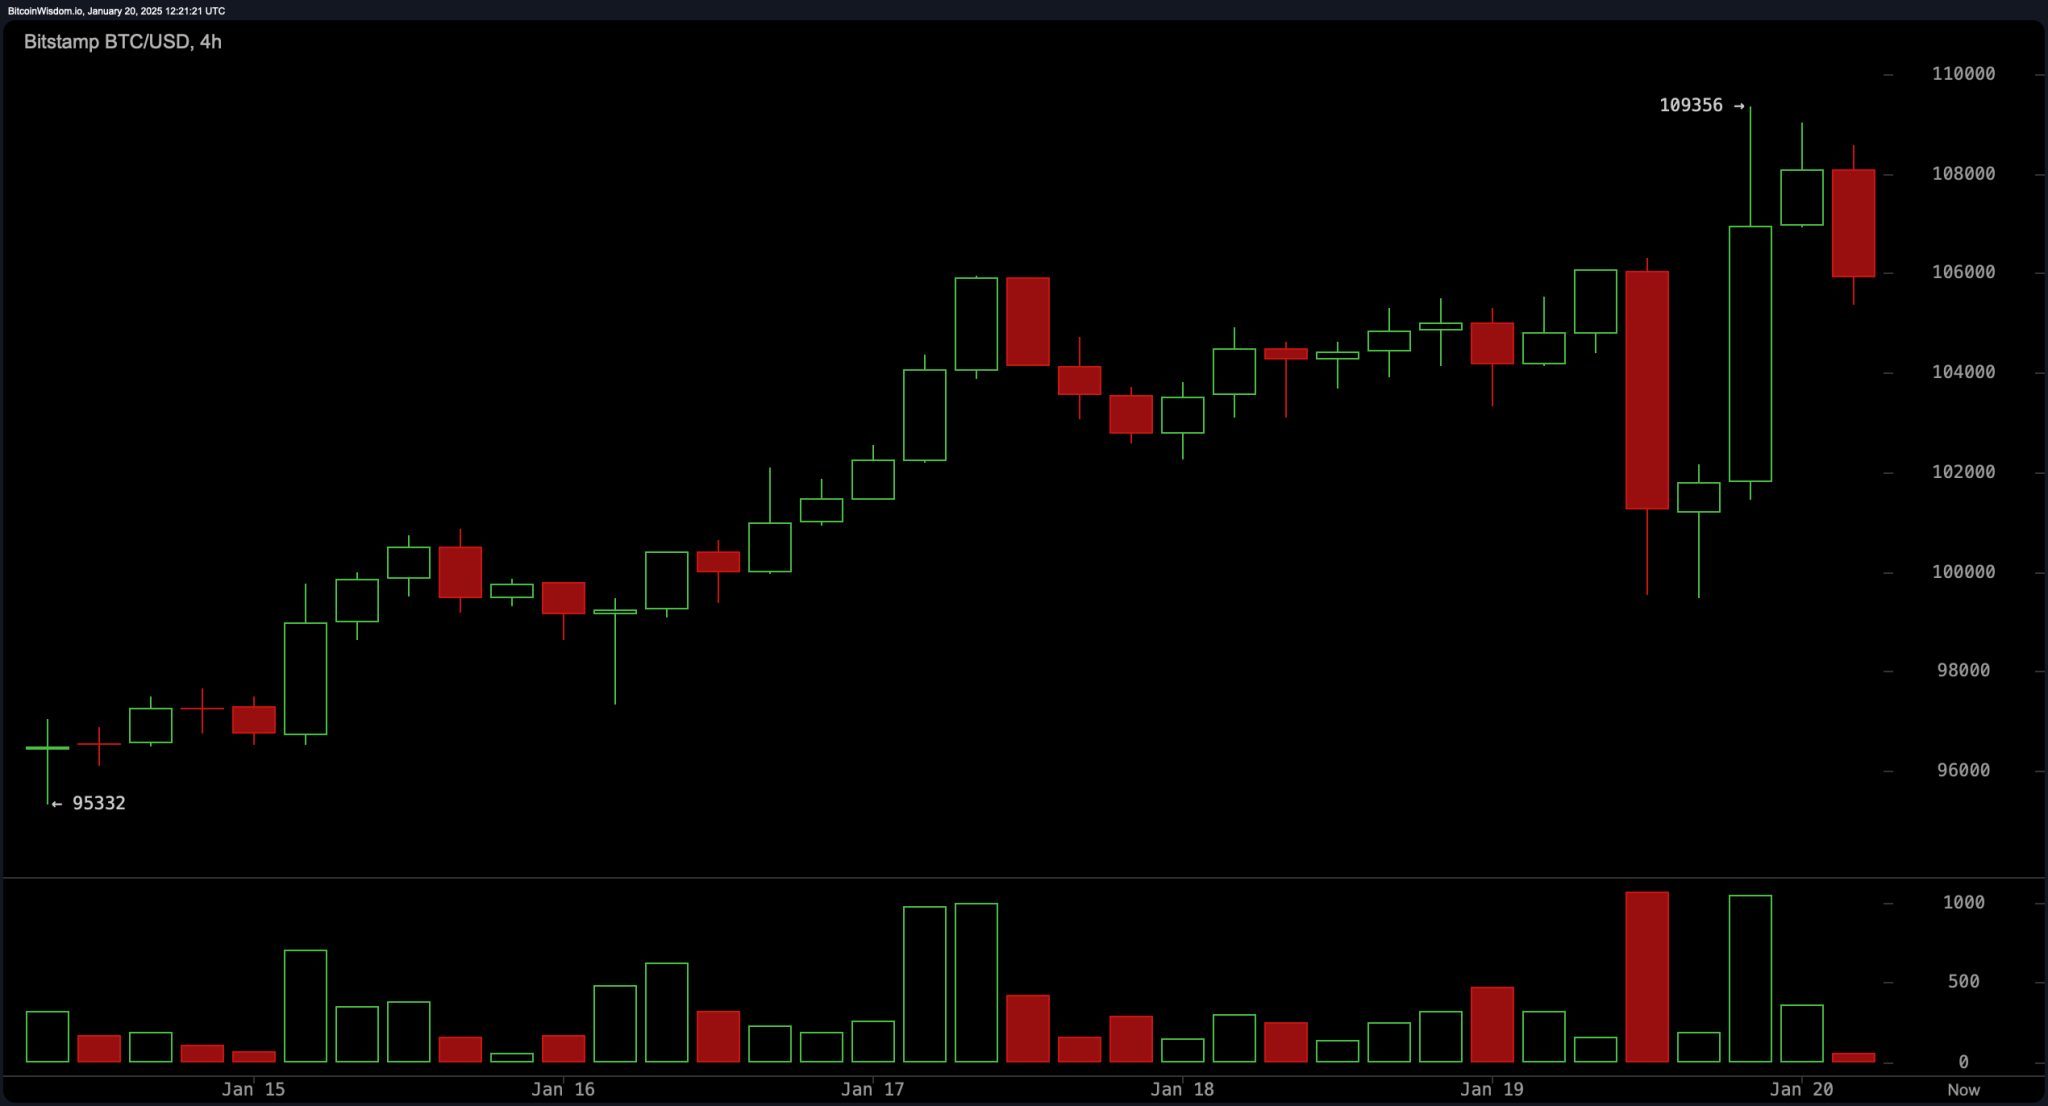
On the 4-hour chart, bitcoin exhibited a decisive advance toward $109,356 before retracing significantly. Attempts to recover are evident, though persistent selling activity near $107,000 has limited upward momentum. Short-term support is identified at $102,000, a level consistent with recent price consolidation and one that may offer a potential entry point for traders targeting a recovery to $107,000. Conversely, a sustained breach below $102,000, particularly if accompanied by heightened volume, would indicate the likelihood of further downside movement, warranting a cautious approach.
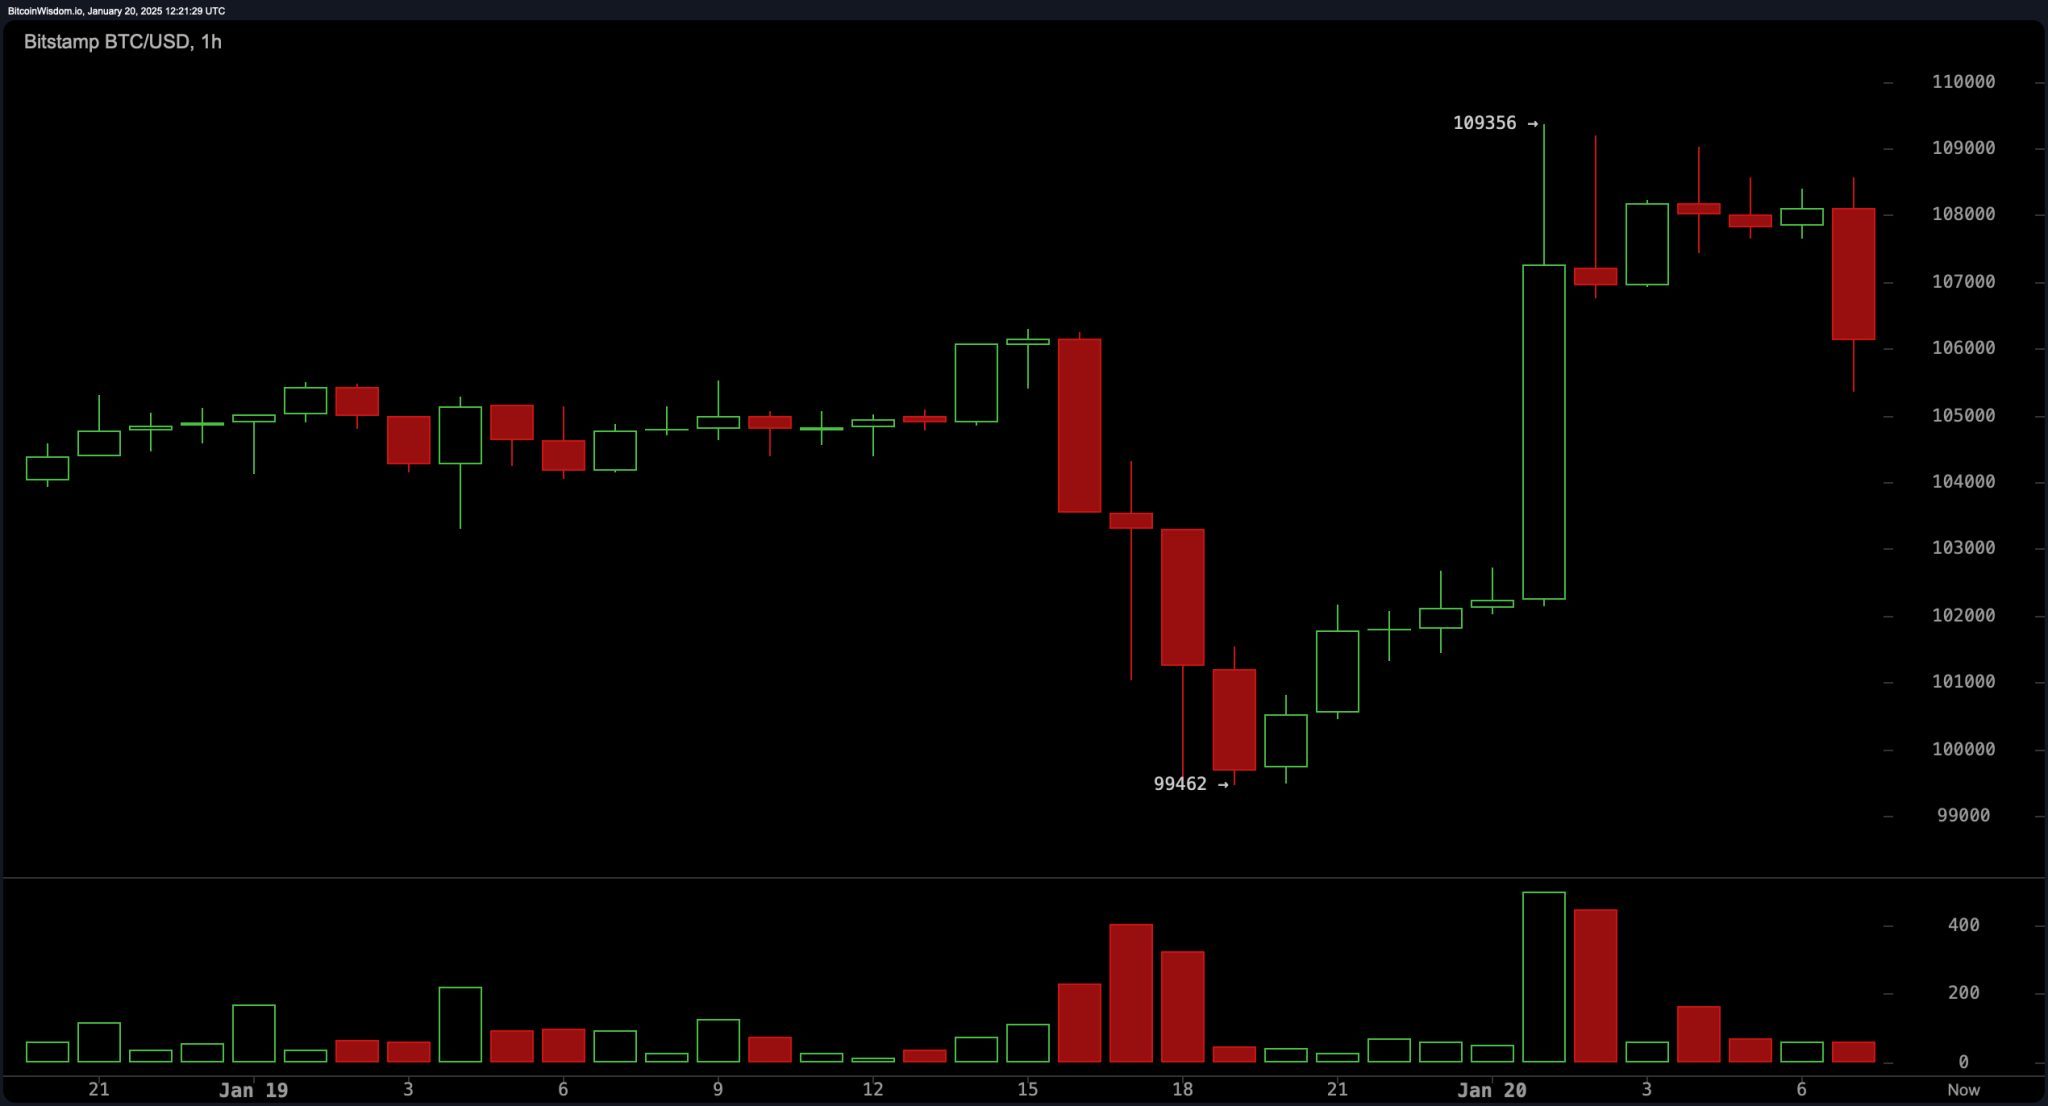
The 1-hour chart encapsulates the pronounced volatility of the session, with a sharp dip to $99,462 followed by a swift recovery. Immediate support at the $100,000 level serves as a psychological anchor, while resistance at $107,000 delineates the upper boundary of the current trading range. The relatively muted buying volume during the recovery phase stands in stark contrast to the earlier intensity of selling, reflecting limited bullish conviction.
Technical oscillators, including the relative strength index (RSI), Stochastic, and commodity channel index (CCI), indicate neutral momentum, reflecting an absence of strong directional signals. Meanwhile, the moving average convergence divergence (MACD) and broader momentum indicators lean toward a buying bias, aligning with a cautiously optimistic sentiment within the overarching trend. Moving averages, both exponential (EMA) and simple (SMA), across multiple timeframes, also align with buy signals, highlighting the potential for upward movement if resistance levels are decisively overcome.
Bull Verdict:
Should bitcoin successfully reclaim and sustain levels above the $109,000 resistance, it would signal renewed bullish momentum. Coupled with strong volume and alignment across technical indicators such as the MACD and moving averages, this breakout could pave the way for further upside, potentially retesting higher price zones. Buyers might capitalize on psychological support at $100,000 and technical support at $95,000, using these levels as foundations for accumulation.
Bear Verdict:
A decisive breakdown below $102,000, particularly with an increase in trading volume, would signify a potential shift toward bearish dominance. Failure to hold the psychological $100,000 level would increase downside risk, with $95,000 as the next critical support zone. Persistent selling pressure and weak buying conviction during recent recoveries suggest that the market may remain vulnerable to additional declines unless a clear bullish catalyst emerges.