
XRP was trading at $2.45 on Jan. 4, 2025, boasting a market capitalization of $140.85 billion. Its 24-hour trading volume reached $4.47 billion, and the day’s price movement ranged between $2.43 and $2.49.

XRP
XRP’s one-hour chart illustrates a phase of consolidation within the $2.45 to $2.50 range, suggesting a possible breakout scenario. Low trading activity in this zone implies that market participants are waiting for a directional cue. With resistance set at $2.50 and support at $2.40, a decisive move above $2.50, backed by significant volume, could present a buying opportunity. A measured profit-taking strategy might focus on the $2.60 mark.
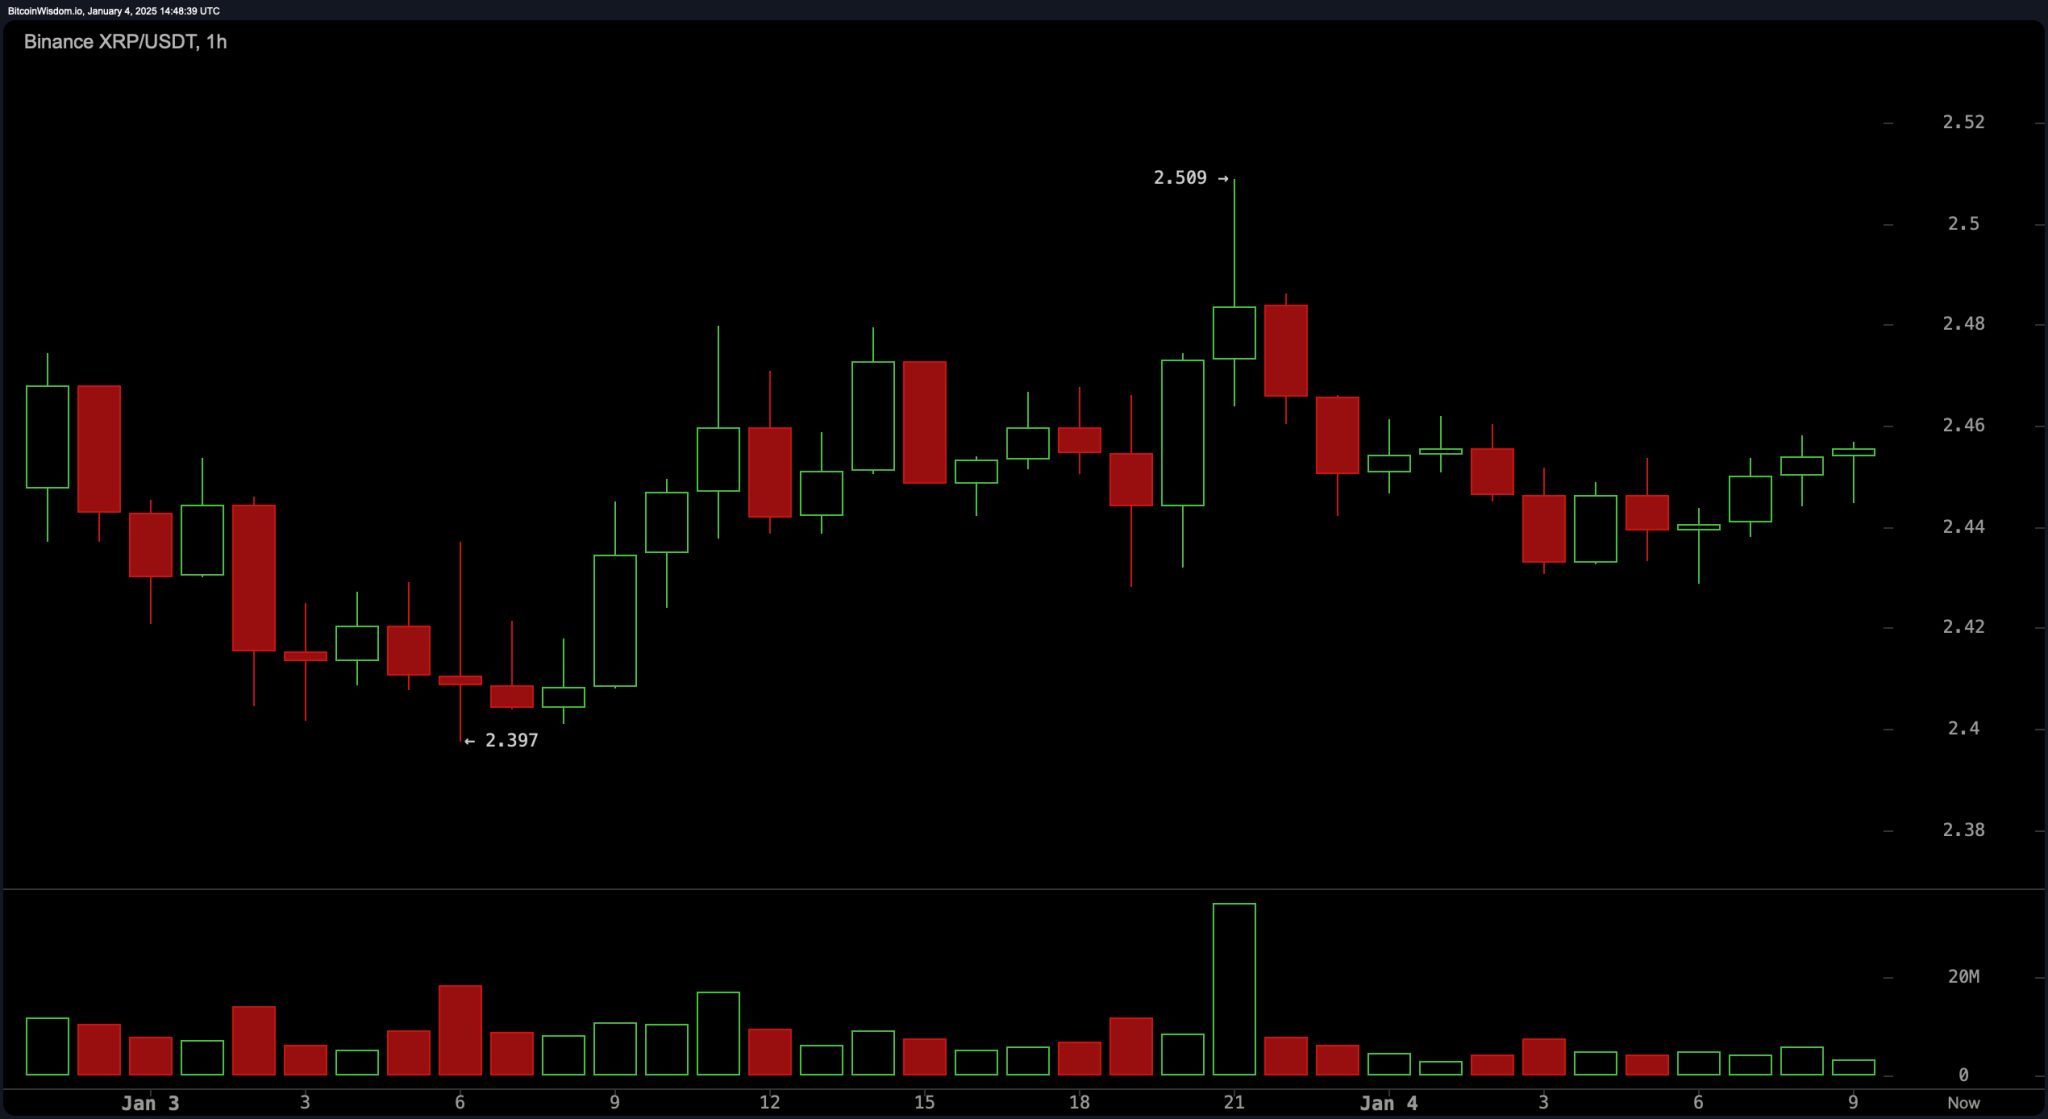
XRP 1H chart on Jan. 4, 2025.
XRP’s four-hour chart emphasizes a consistent uptrend, interrupted only by brief consolidations below $2.50. Bullish candlesticks and synchronized volume surges highlight steady momentum. Key levels include short-term resistance at $2.50 and support at $2.20. A breakout above the consolidation point near $2.30 could mark an attractive entry, with targets extending toward $2.50 and beyond.
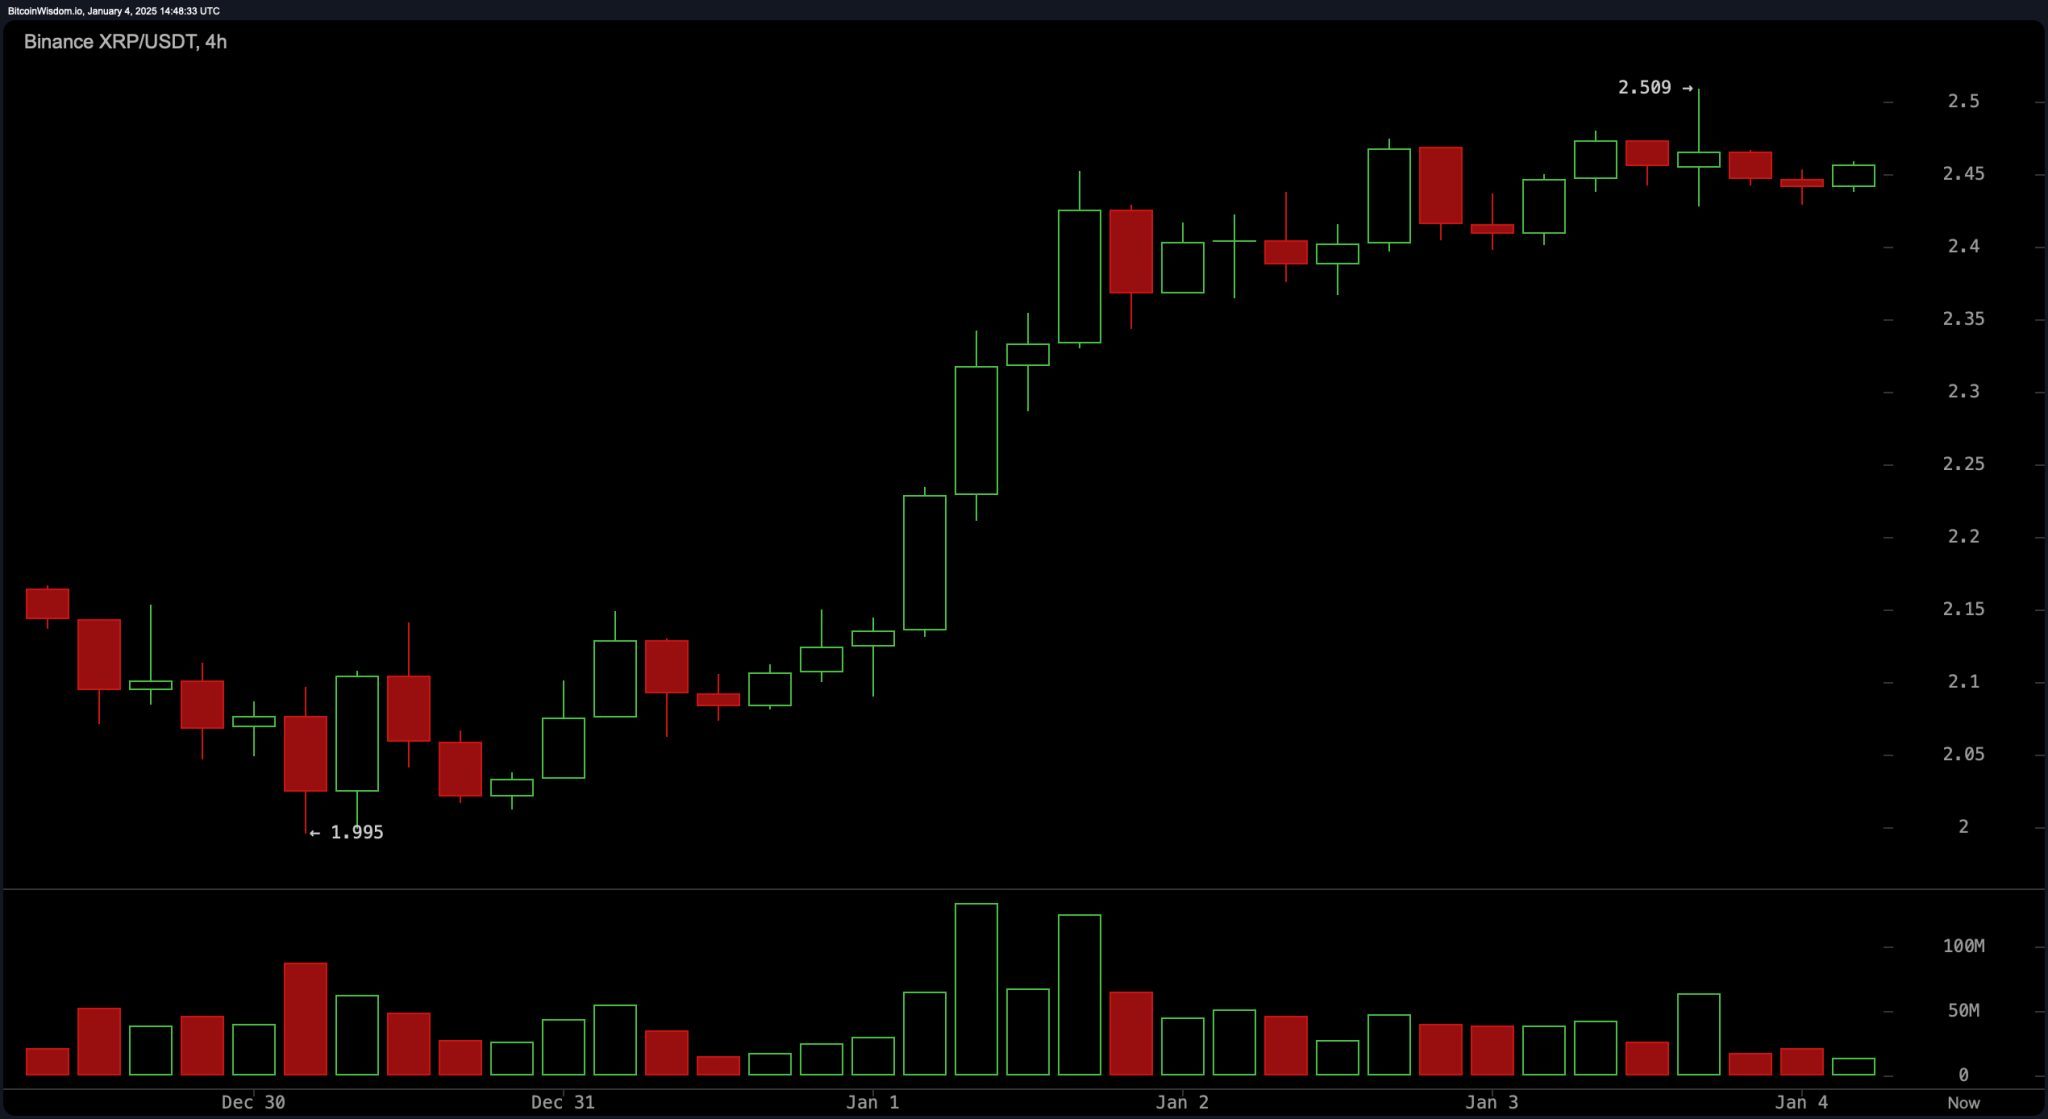
XRP 4H chart on Jan. 4, 2025.
On the daily chart, XRP maintains its upward trajectory, forming progressively higher lows and highs. A broader range is defined by resistance at $2.90 and support at $2.00. Significant buying activity accompanies upward price movements, while a pullback to $2.20–$2.30 could offer potential entry points. Resistance zones near $2.75–$2.90 may serve as profit-taking opportunities.
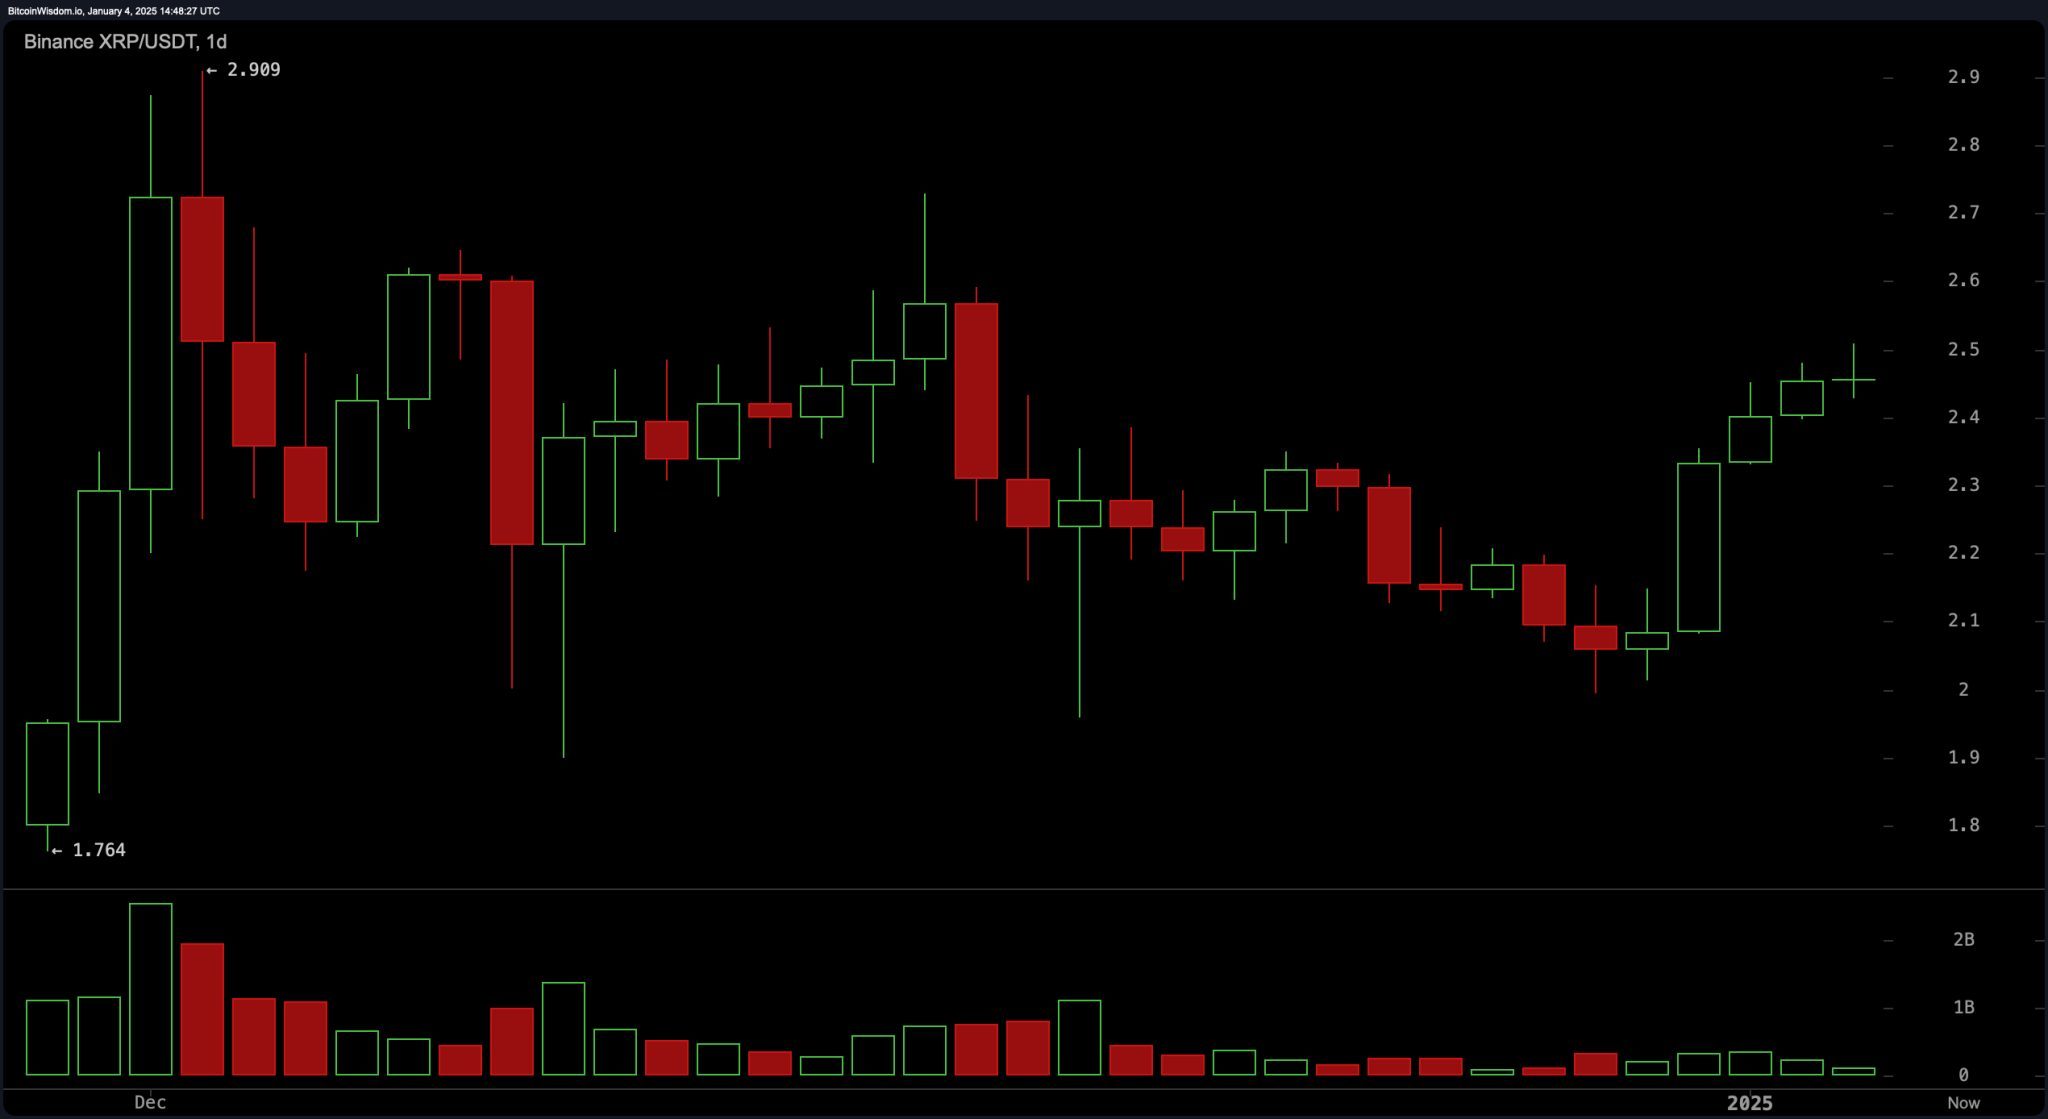
XRP Daily chart on Jan. 4, 2025.
Oscillator readings provide mixed insights. The relative strength index (RSI) sits at 61.66, suggesting neutrality, while the stochastic oscillator at 91.92 and the commodity channel index (CCI) at 113.03 similarly indicate balanced conditions. Meanwhile, momentum at 0.162 and the moving average convergence divergence (MACD) at 0.072 lean toward a favorable buying outlook.
Moving averages (MAs) reinforce bullish sentiment across short- and long-term indicators, with both exponential (EMA) and simple moving averages (SMA) aligning on a buy signal across multiple timeframes. A word of caution stems from the hull moving average (HMA) at 2.49876, urging close attention to price dynamics in this range.
Bull Verdict:
XRP’s technical indicators and price action suggest a bullish outlook, with strong support levels, consistent buy signals from moving averages, and momentum favoring upward movement. A breakout above $2.50 could pave the way to test resistance near $2.75 or even $2.90, offering substantial upside potential for traders.
Bear Verdict:
Despite the bullish signals, XRP’s consolidation near key resistance and low volume in critical ranges raise caution. A failure to break above $2.50, combined with potential sell signals like the HMA, could trigger a reversal, testing support near $2.40 or lower.