
On Thursday, XRP is currently dancing at a price of $2.36 to $2.40 in the last hour, with a market valuation soaring to $137 billion and a 24-hour trading volume hitting $9.65 billion, bouncing between an intraday range of $2.16 to $2.452.

XRP
In the short term, XRP’s 1-hour chart is on a upward journey, marked by higher highs and higher lows, having kicked off from $2.09 on Jan. 1. The price is now flirting with resistance at $2.45, with tiny candles forming, hinting at either a moment to catch breath or a thrilling breakout. Key support lingers at $2.4, and traders might be on the lookout for either a surge past $2.45 or a dip back to $2.35 for some trading action.
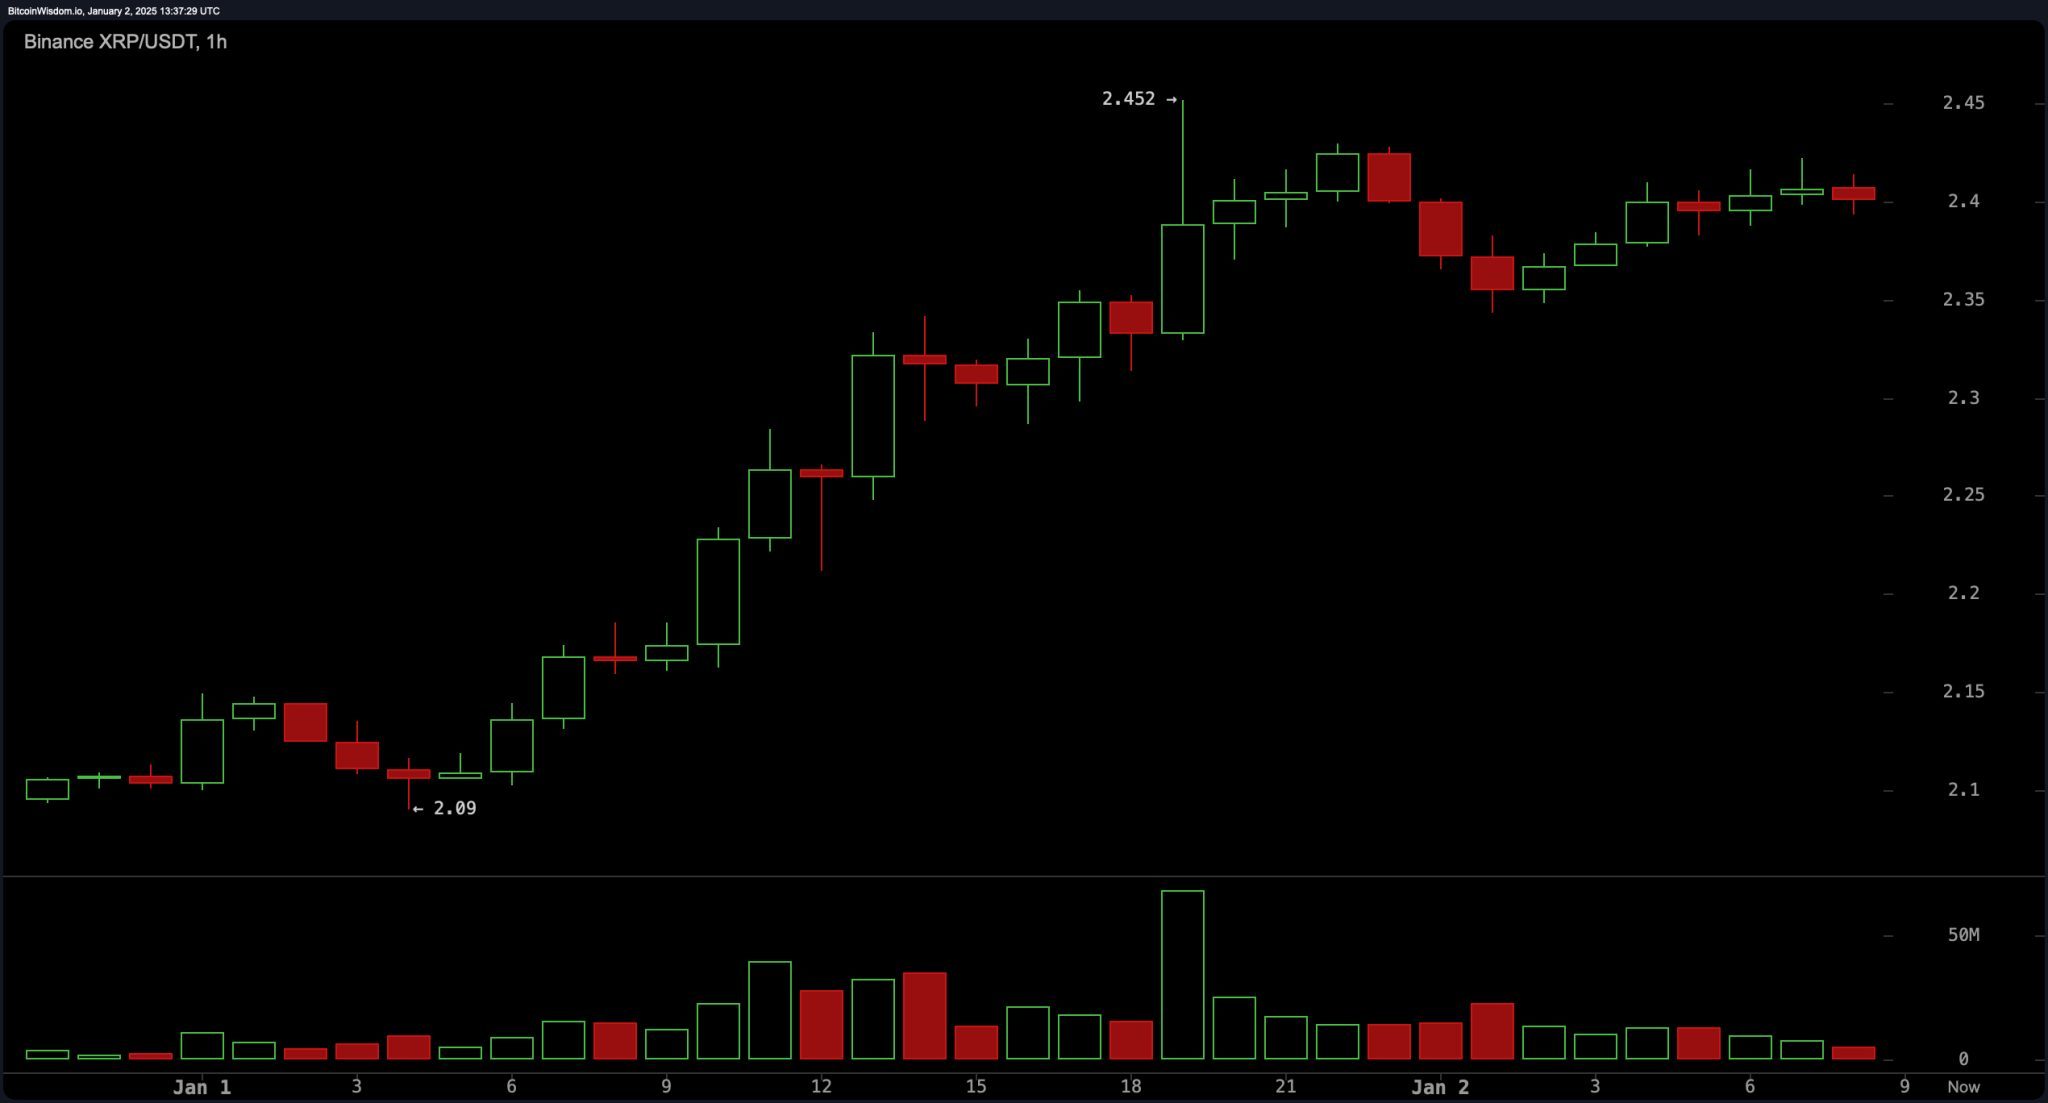
XRP/USD 1H chart on Jan. 2, 2025.
On the 4-hour chart, XRP has performed a dazzling V-shaped recovery, springing back from $1.995 on Dec. 30 to its current stance at $2.40. The breakout above $2.2 was accompanied by a spike in volume, showing eager buyers, though the calm near $2.45 with lower volume suggests some are cashing in their chips. Support levels to watch are at $2.2 and $2.3, with a break above $2.45 potentially setting the stage for a dash towards $2.5 or beyond.
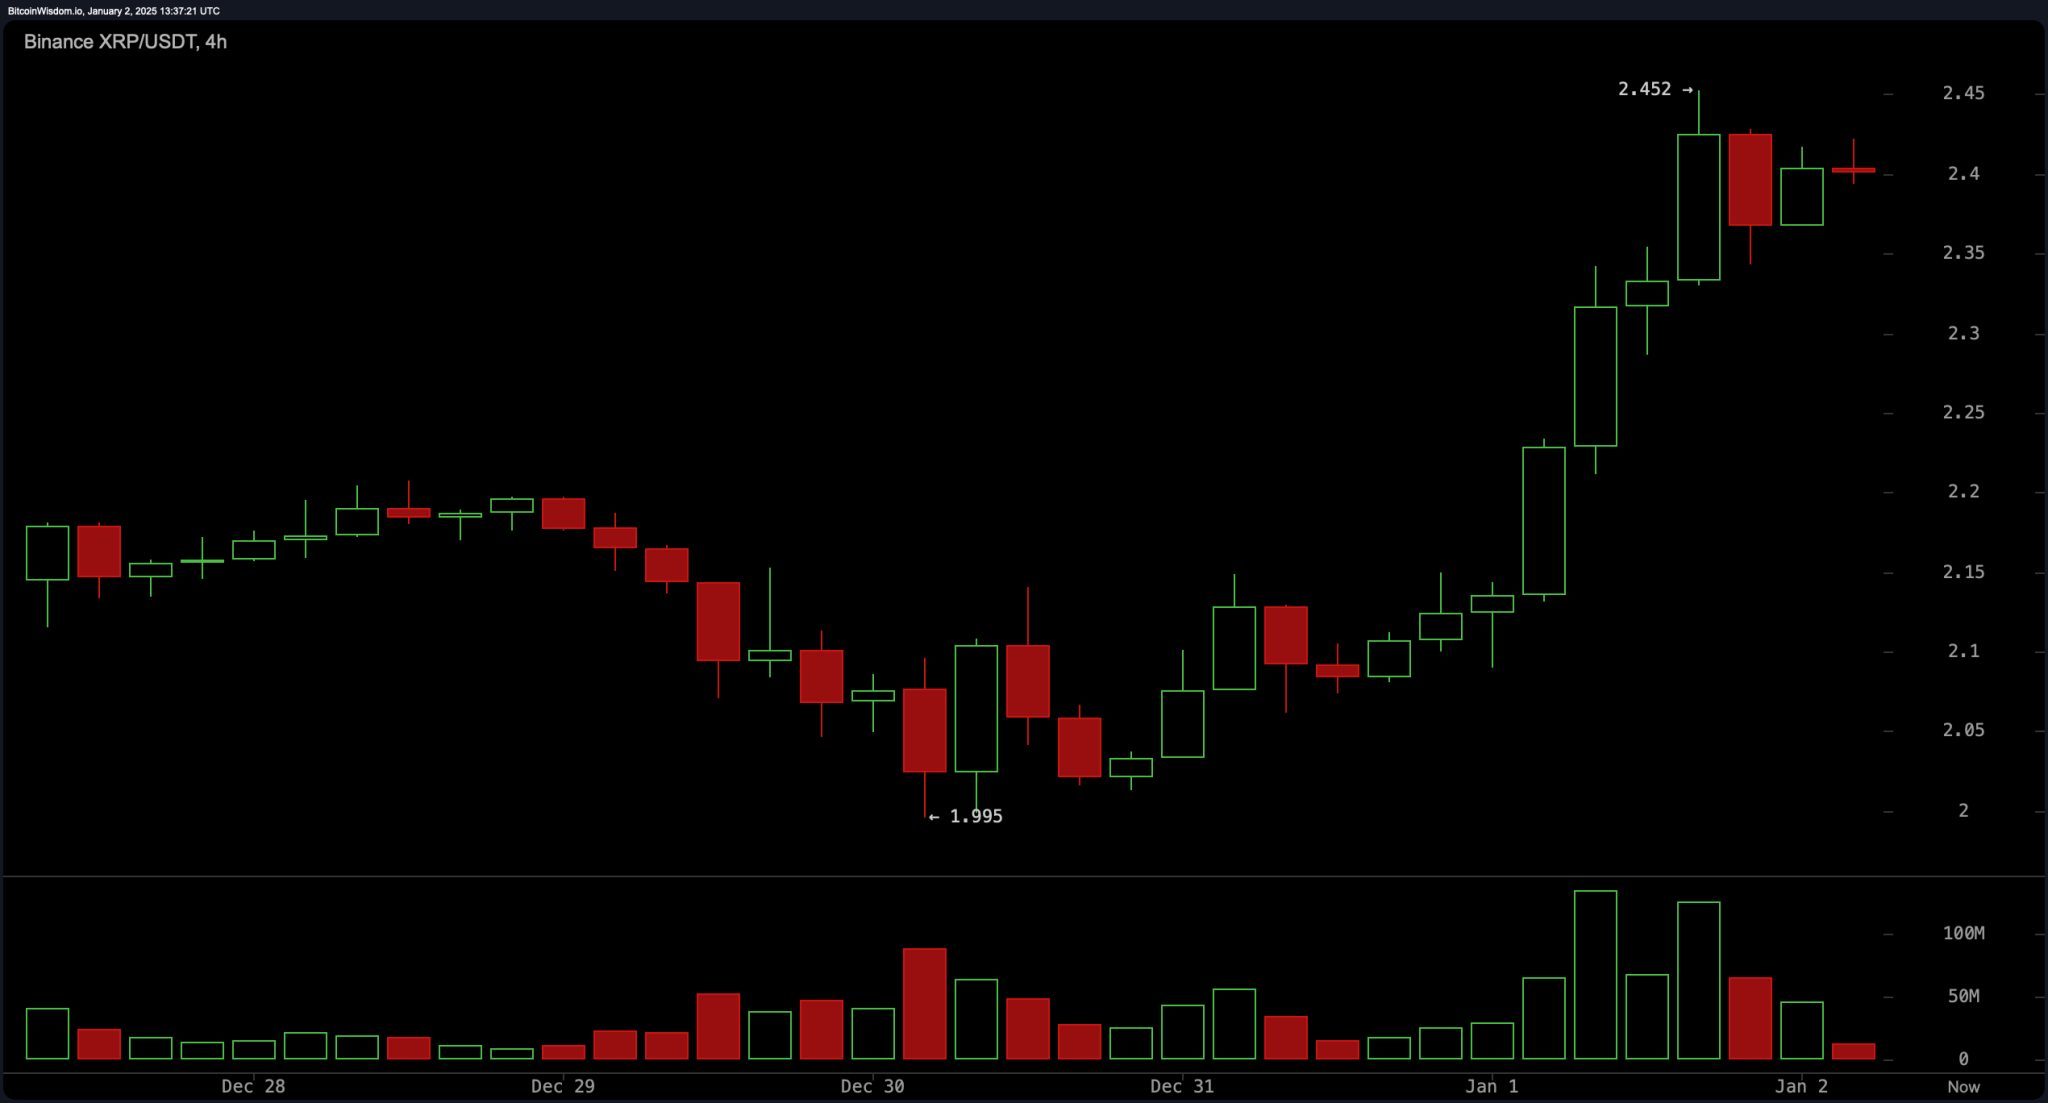
XRP/USD 4H chart on Jan. 2, 2025.
The daily chart paints a vibrant picture of bullishness, with XRP clustering around $2.1 before smashing through resistance at $2.3. A bold green candle has lit up, indicating fresh buying energy. Critical levels include support at $2.1 and resistance points at $2.5 and $2.9. The breakout was backed by increased volume, suggesting the uptrend might keep climbing, but traders should tread carefully around $2.9, known for its resistance.
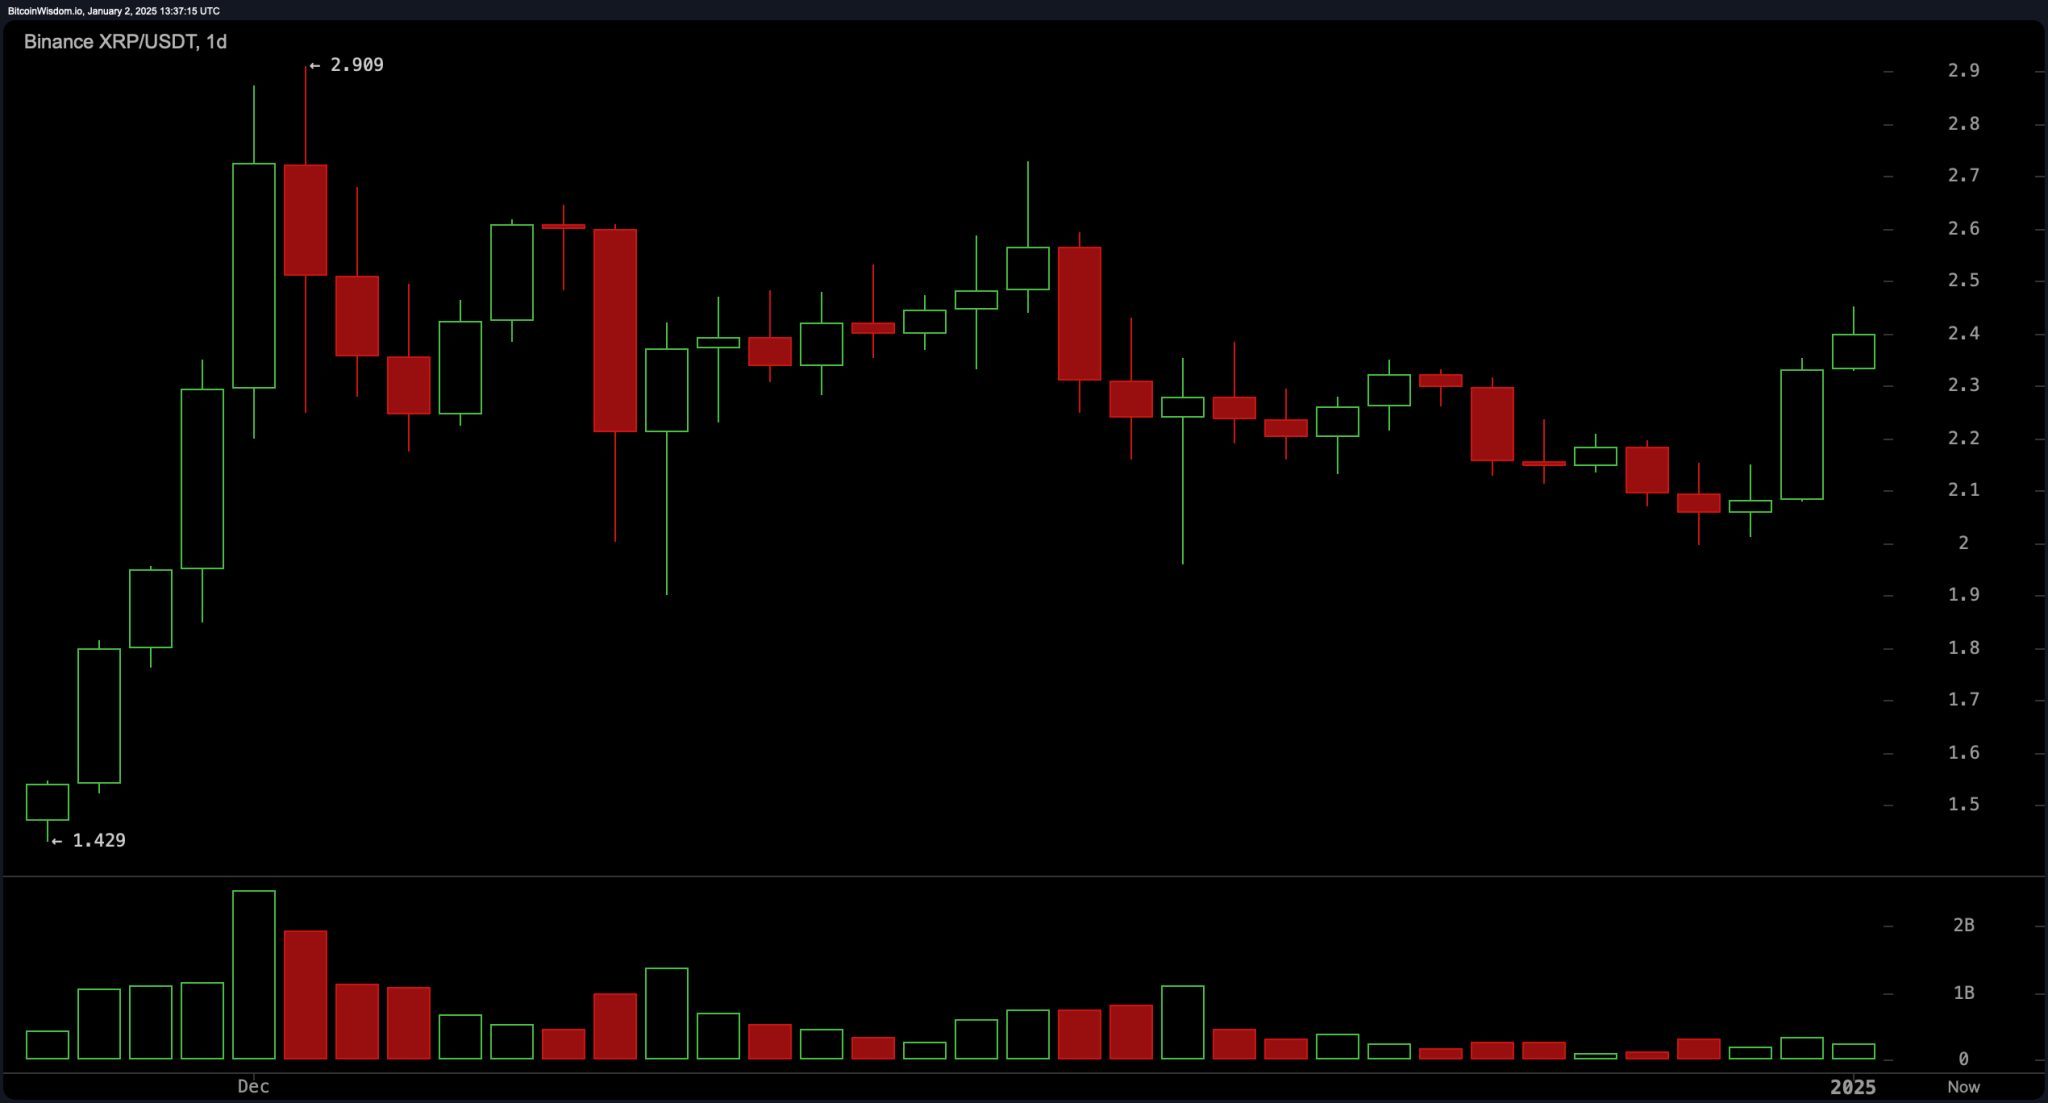
XRP/USD Daily chart on Jan. 2, 2025.
Oscillator indicators are showing a mixed bag of emotions. The relative strength index (RSI) plays it cool at 59.75, while the Stochastic oscillator is also neutral at 62.44. The momentum oscillator gives a buying signal, hinting at upward pressure, but the moving average convergence divergence (MACD) signals negativity at 0.04772, suggesting some short-term resistance. Other indicators like the commodity channel index (CCI) and average directional index (ADX) are maintaining a neutral stance.
Moving averages are still all in on the bullish party. Both short- and long-term trends, represented by simple moving averages (SMA) and exponential moving averages (EMA), are flashing buy signals across various timeframes. Important markers include the 10-day EMA at $2.23 and the 100-day EMA at $1.52, aligning perfectly with the ongoing rally. These indicators give traders the green light to aim for higher peaks with confidence.
Bull Verdict:
The technical indicators and price action suggest a continuation of XRP’s bullish trend. With strong support levels, increasing volume during key breakouts, and confirmation from moving averages, XRP appears well-positioned to test $2.5 and possibly approach $2.9 if market momentum persists.
Bear Verdict:
Despite the upward trajectory, caution is warranted. Consolidation near $2.45 and mixed oscillator signals, particularly the sell indication from the moving average convergence divergence (MACD), suggest the potential for a short-term pullback. A break below $2.3 could signal bearish momentum and a possible trend reversal.