
XRP traded at $2.37 on March 22, 2025, with a market capitalization of $137 billion and a 24-hour trade volume of $1.73 billion. The price fluctuated between $2.35 and $2.42, showcasing a narrow trading band amid technical indecision across multiple timeframes.


XRP
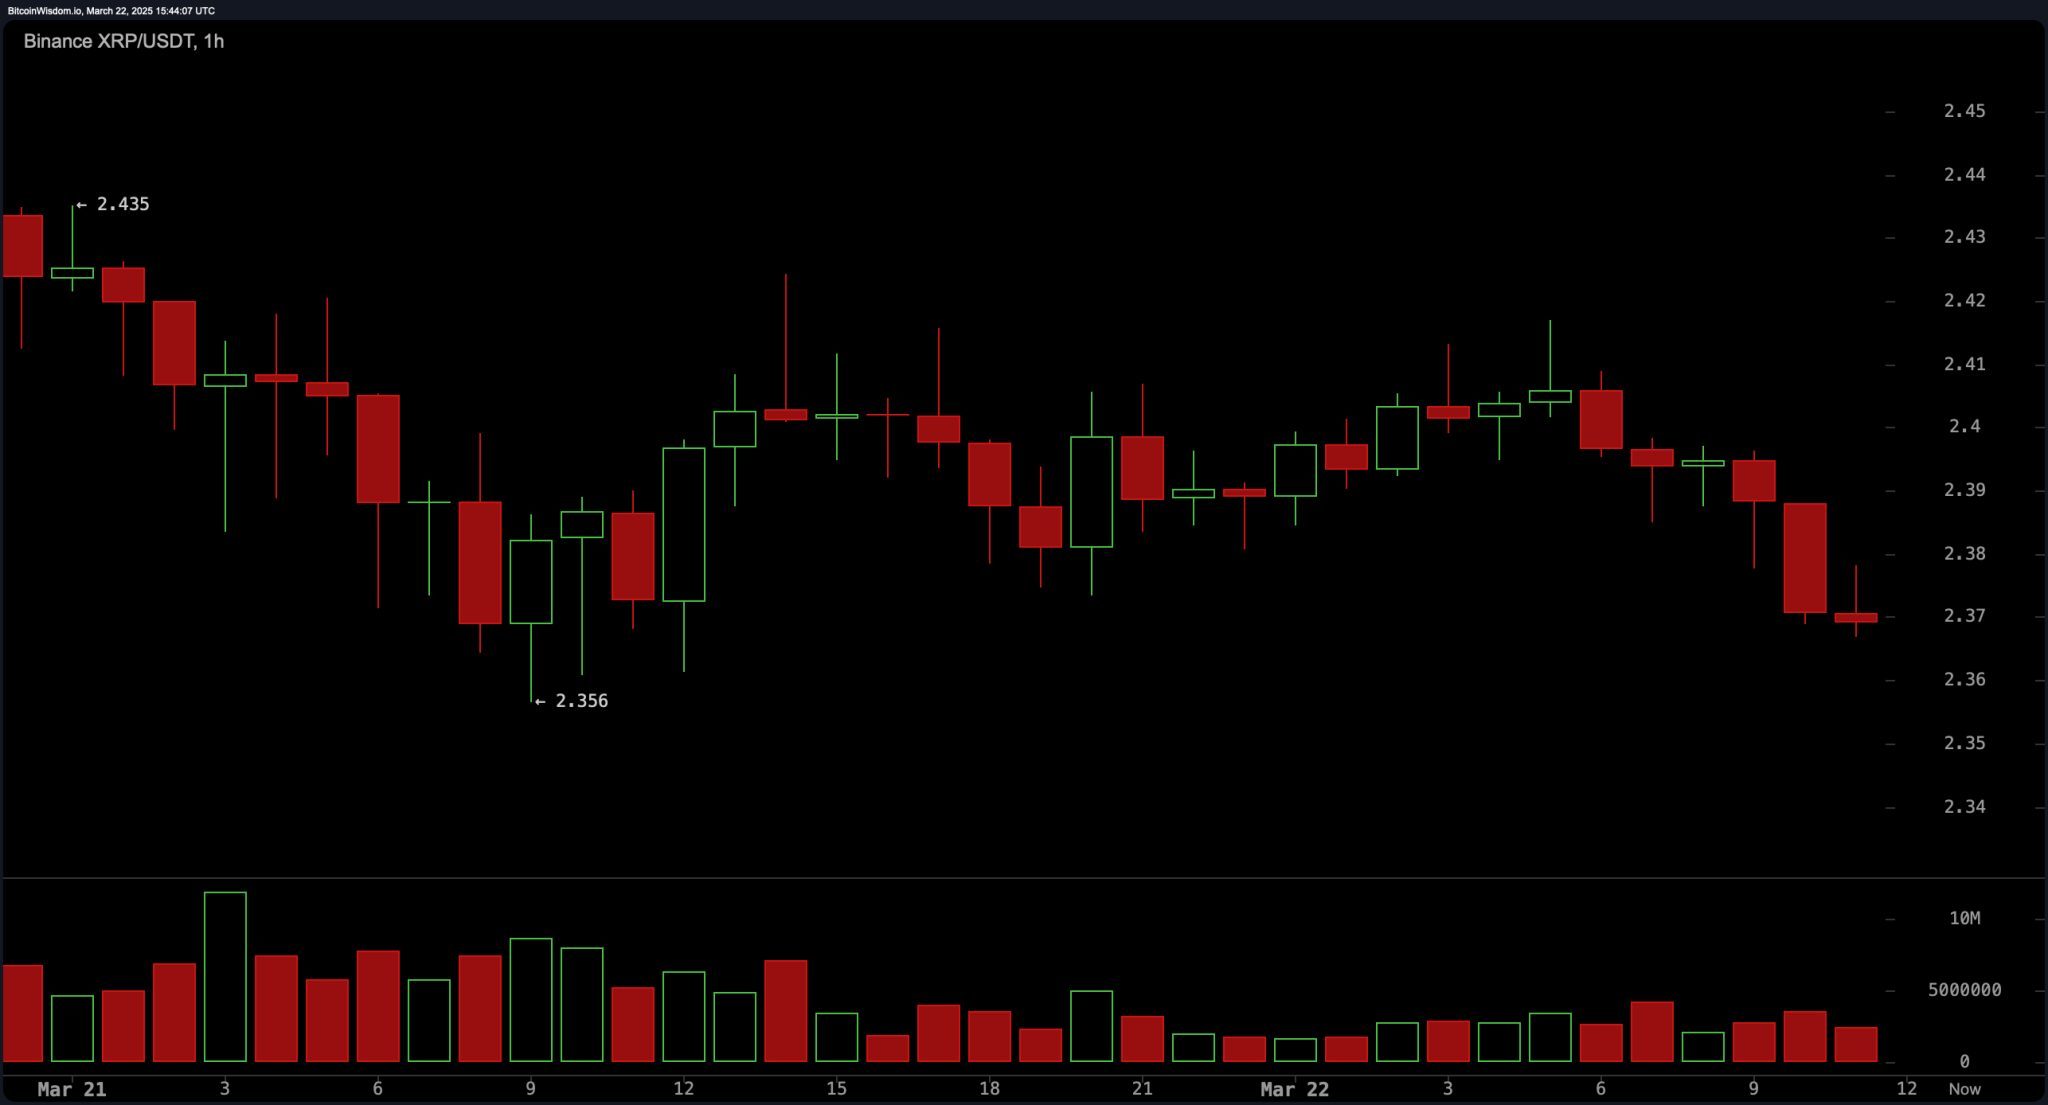
On the 1-hour chart, XRP hovered within a tight range, facing support around $2.356 and resistance near $2.435. The price action suggested a descending triangle pattern, marked by lower highs and steady lows—a traditionally bearish formation. However, the low volume observed throughout the hour hinted at a lack of decisive momentum from either bulls or bears. A clear break below $2.356 could signal a short-term downside, while failure to breach this level might prompt a quick bullish reversal targeting $2.43 or higher. Scalpers are closely watching for a breakout or breakdown to capitalize on short-lived price swings.
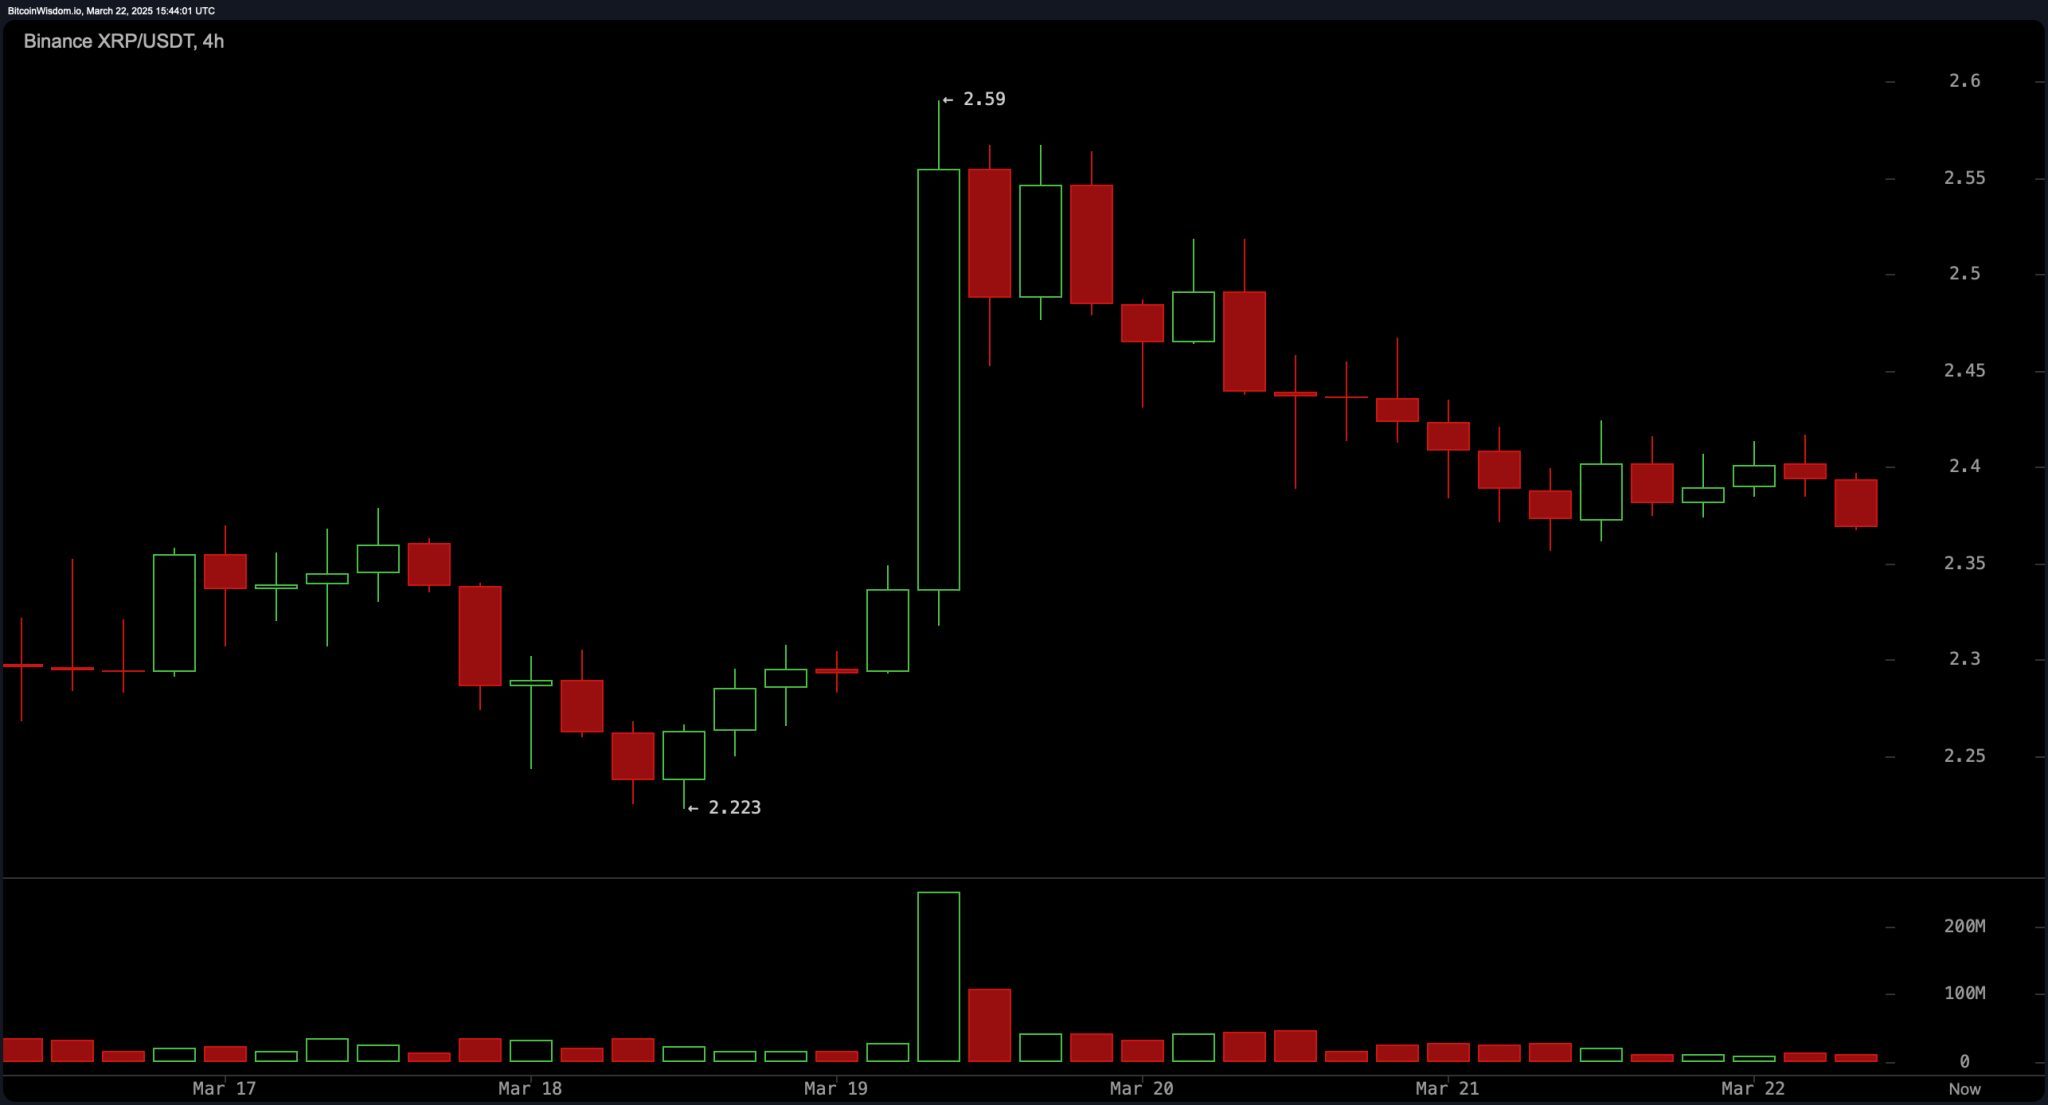
The 4-hour chart painted a mid-term corrective phase, with XRP retracing from a recent high of $2.59. Support at $2.22 proved resilient during previous sell-offs, but a descending channel has emerged, with each rally topping out lower than the last. Price consolidation within this downtrend indicates short-term bearish momentum, though the structure resembles a potential bull flag if $2.35 support continues to hold. A breakout above the descending trendline near $2.45 could revive bullish sentiment with an initial upside target of $2.60. Conversely, a confirmed loss of $2.35 support may see the price revisit the $2.22 region.
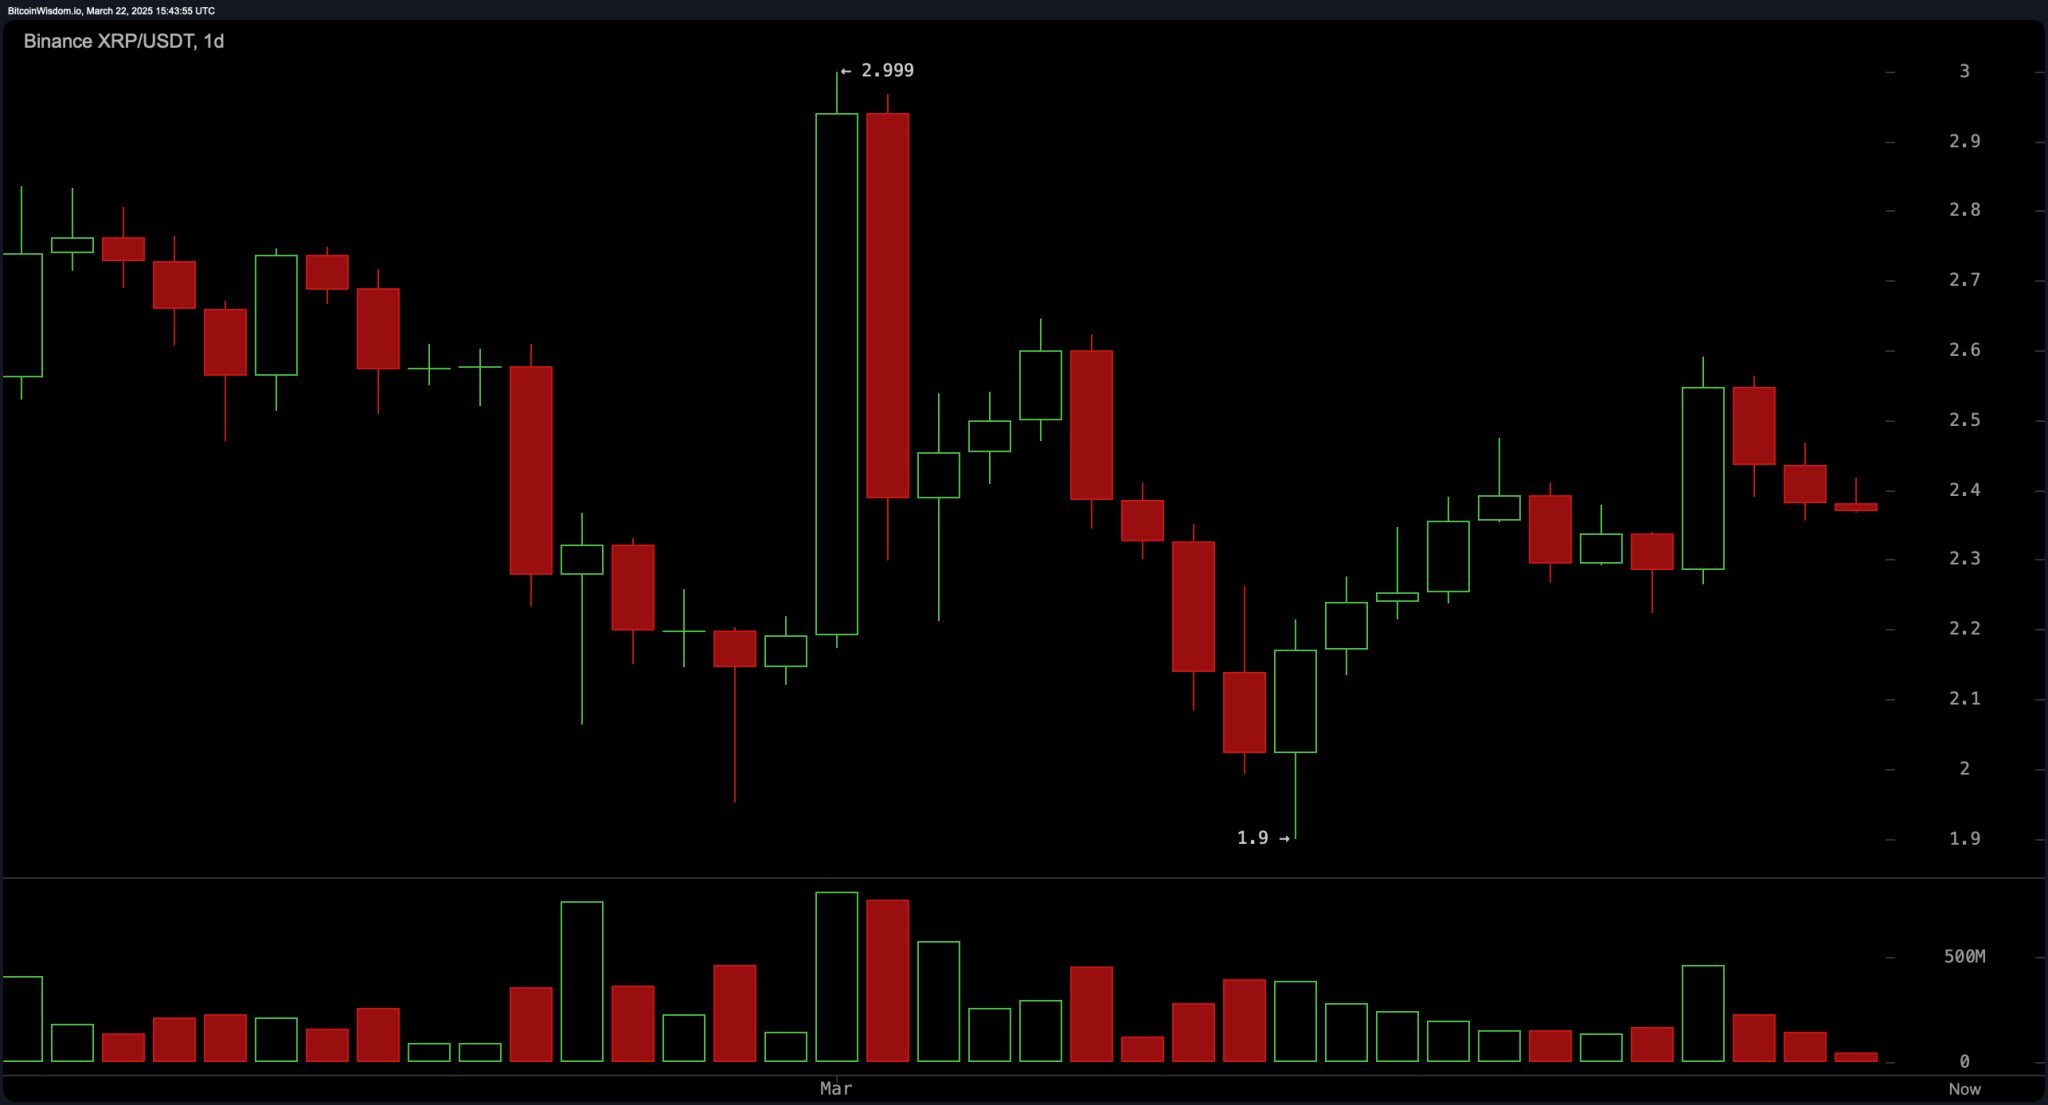
The daily chart presented a broader view of XRP’s recent activity, showing price action stabilizing after a failed breakout to nearly $3.00. The current consolidation between $2.30 and $2.50 follows a steep pullback and appears to be forming a base. Key support is situated around $1.90, while resistance at $2.999 remains a critical ceiling. Daily candlesticks are characterized by tight ranges and declining volume, signaling market indecision. A bullish continuation would require a strong reclaim of the $2.60 level backed by renewed volume; otherwise, a drift back toward the $2.30–$2.20 support zone could unfold.
Oscillators revealed a largely neutral stance in the market. The relative strength index (RSI) stood at 49.3, suggesting a balance between buying and selling pressures. The Stochastic indicator at 70.5 and the commodity channel index (CCI) at 19.75 both echoed neutrality, while the average directional index (ADX) at 14.8 showed weak trend strength. The awesome oscillator offered a mild bullish signal with a value of 0.00282, while momentum slipped into bearish territory at 0.12887. Interestingly, the moving average convergence divergence (MACD) showed an optomistic signal at -0.01962, adding a hint of divergence across oscillators and confirming the broader indecisive sentiment.
Moving averages (MAs) displayed a complex configuration across timeframes. The exponential moving average (EMA) and simple moving average (SMA) for 10 periods showed buy signals, suggesting short-term support around $2.36–$2.37. However, the 20- and 30-period exponential moving averages issued sell signals, indicating overhead resistance. Longer-term 100- and 200-period averages largely favored the bulls, especially the 200-period moving averages with values well below current price levels, indicating structural support. Mixed signals from mid-range averages (20 to 50 periods) reflect XRP’s struggle to maintain upward momentum. The clash between short-term bullish and mid-term bearish moving averages highlights a market caught in transition.
Bull Verdict:
If buyers can defend the $2.35 support level and reclaim $2.45–$2.50 with rising volume, XRP could break free from its descending structures and aim for $2.60, potentially revisiting $2.80 or even the $3.00 resistance zone. Support from long-term moving averages and the buy signals from short-term moving averages provide a foundational case for further upside if momentum returns.
Bear Verdict:
Failure to hold the $2.35 support level, particularly if volume increases on a breakdown, could open the door for a retracement toward $2.22 or lower. The descending triangle on the 1-hour chart, the ongoing pullback on the 4-hour chart, and the neutral-to-bearish signals from several oscillators and mid-range moving averages reinforce the risk of continued downward pressure.