
XRP is currently trading at $2.27 to $2.32 over the past hour, with a market capitalization of $131 billion and a 24-hour trading volume of $4.82 billion, moving within an intraday range of $2.14 to $2.28, as technical indicators across multiple timeframes reveal a mixed sentiment with both bullish and bearish signals shaping the market outlook.

XRP
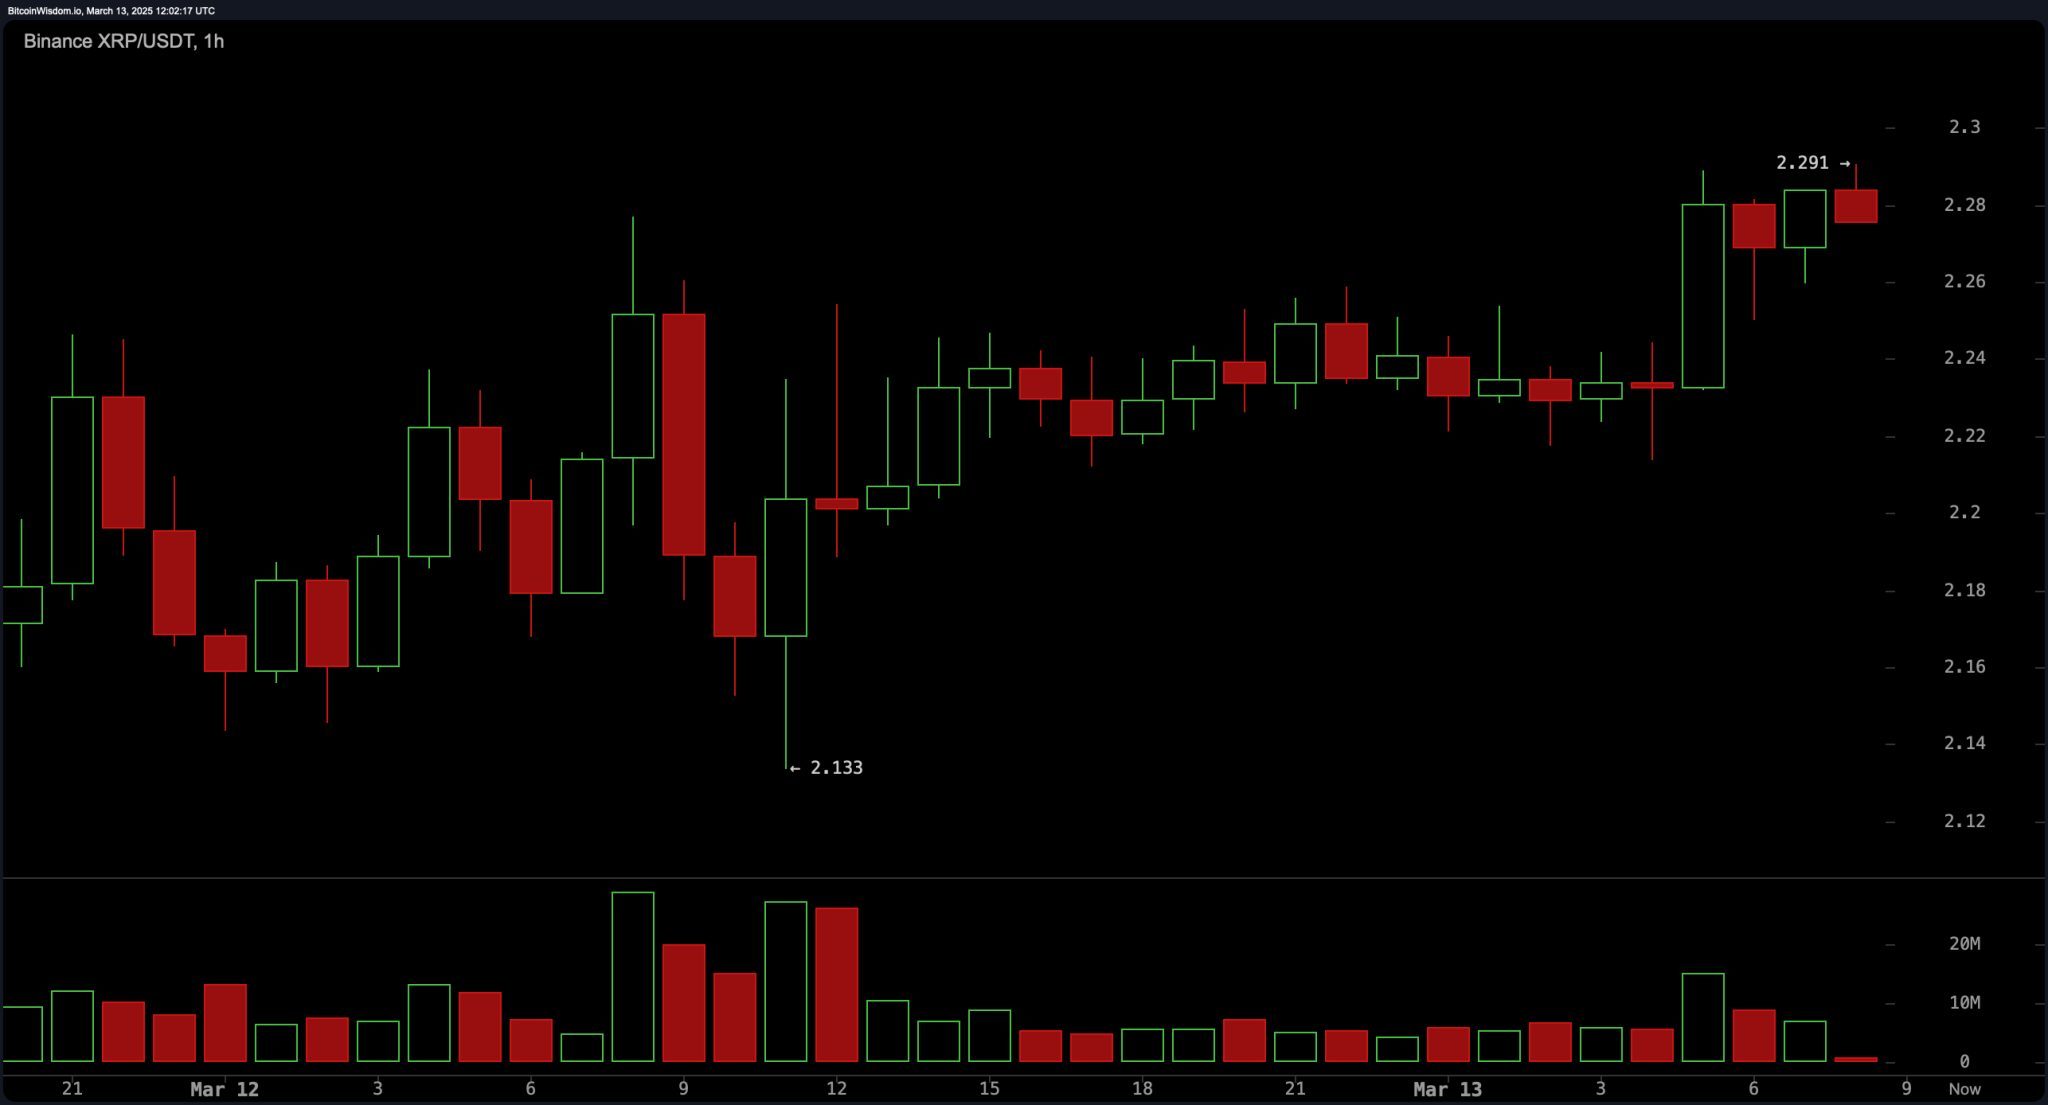
On the one-hour chart, XRP is consolidating between $2.25 and $2.30, showing resistance around $2.30 while holding support near $2.25. A breakout above $2.30 could push the price toward $2.40, but a lack of strong volume suggests caution. The short-term price action suggests a potential bullish flag or pennant pattern, indicating that an increase in momentum could lead to a breakout. However, if volume continues to decline, a possible retracement to the $2.22 support level is likely before any significant upward movement.
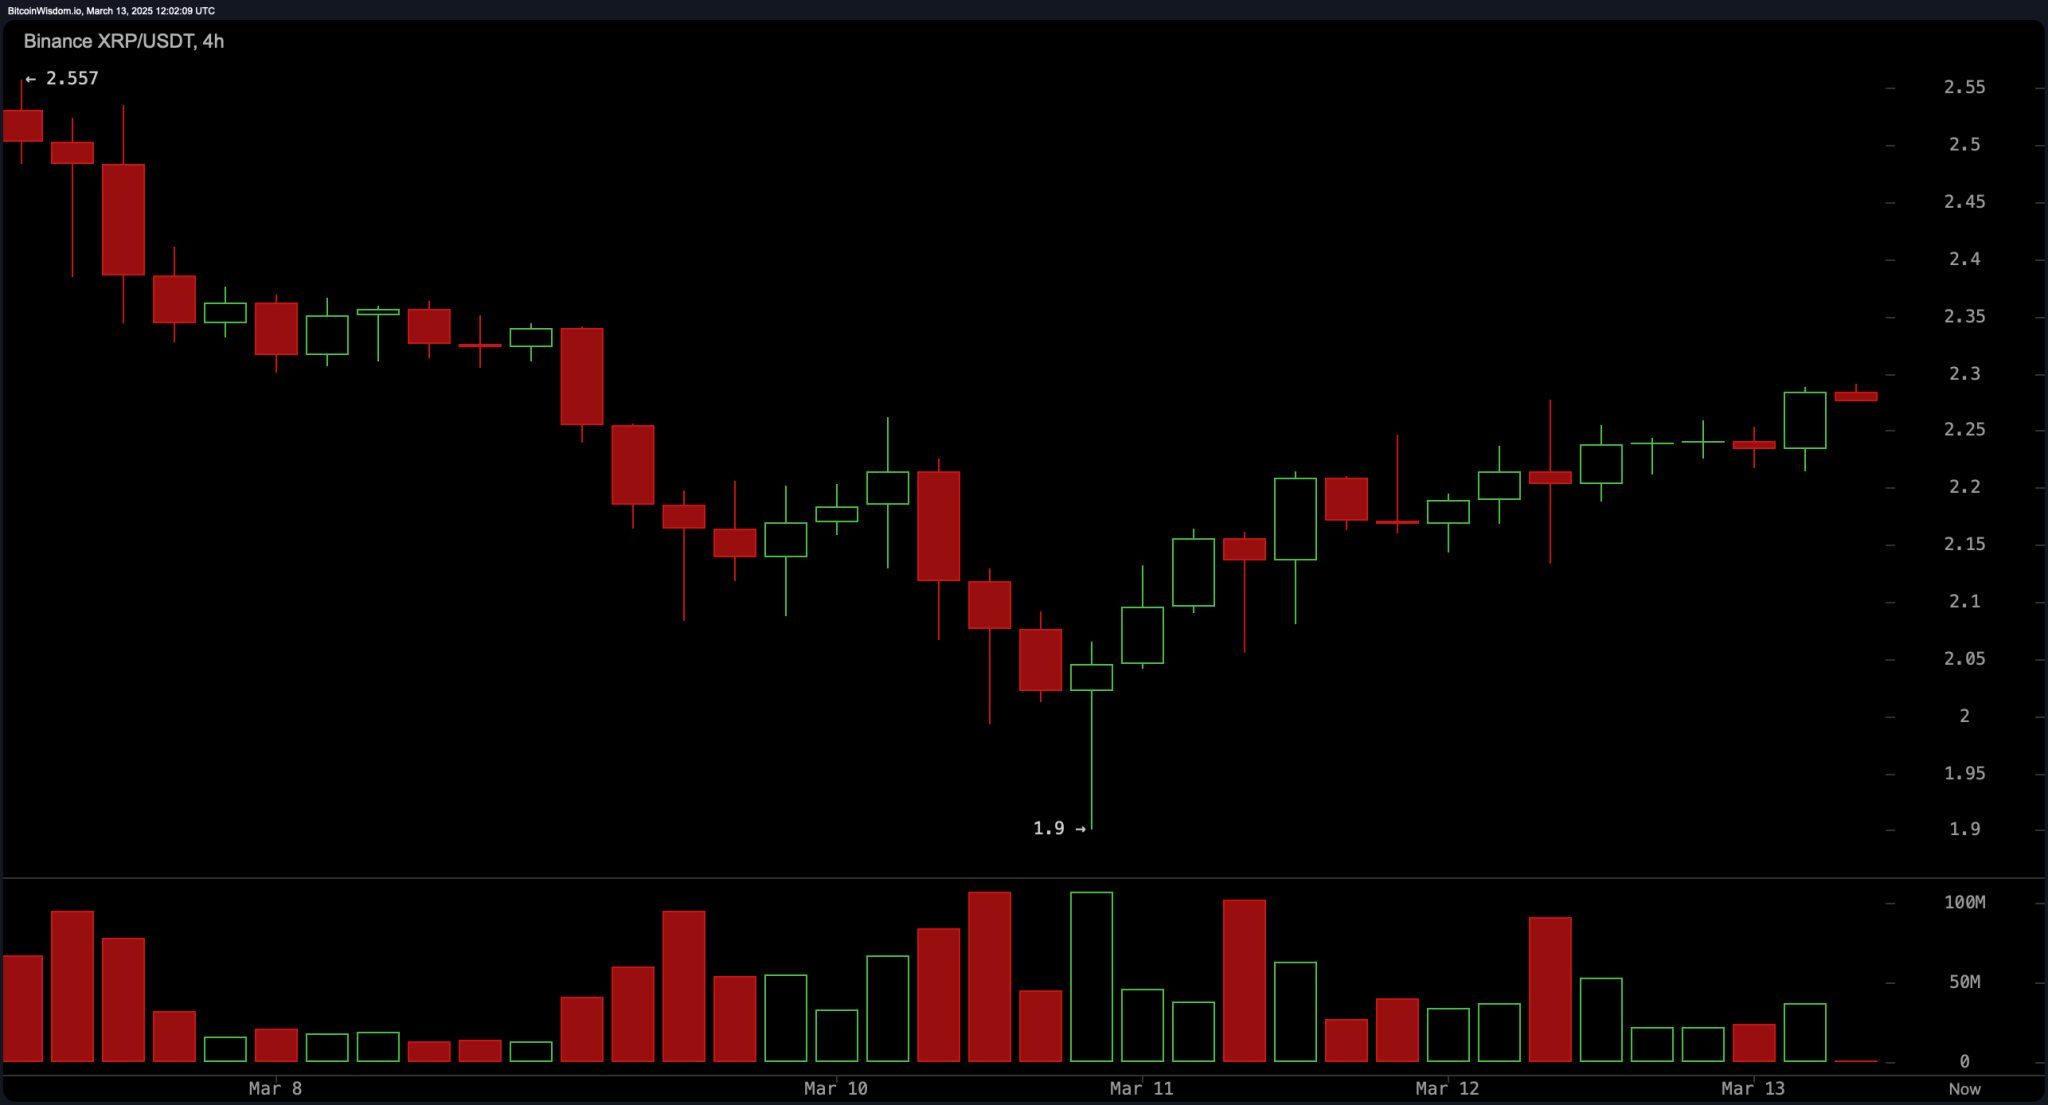
The four-hour chart highlights a steady climb from the $1.90 low, with the price now facing resistance around $2.35 to $2.40. While the initial uptrend saw a surge in volume, the recent price action suggests consolidation as traders assess the next move. A successful retest and hold of the $2.15 to $2.20 support range would reinforce bullish momentum, with potential upside targets at $2.50 to $2.55. Conversely, failure to hold above $2.20 may indicate a deeper pullback before the next attempt at higher resistance levels.
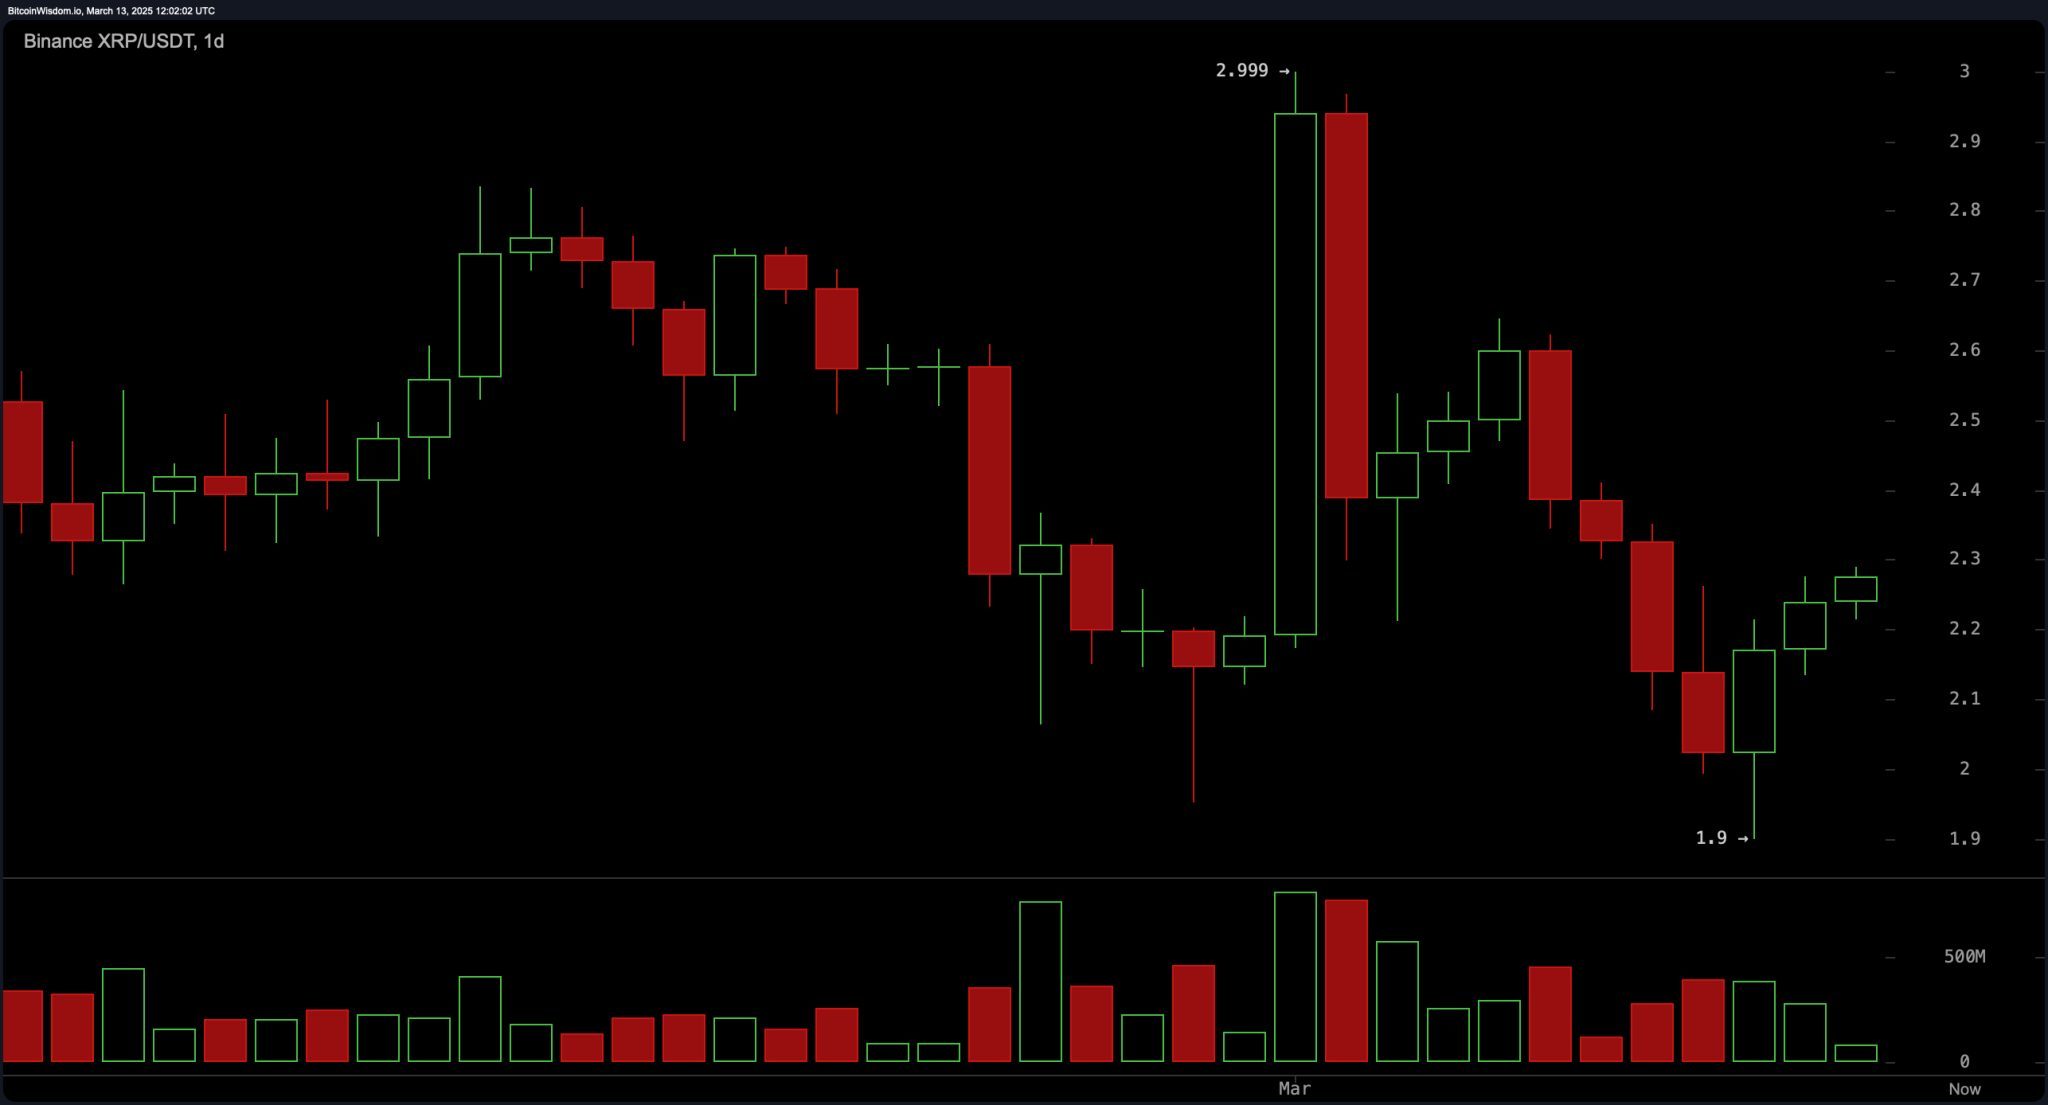
On the daily chart, XRP recently rejected a sharp spike to $2.99, finding strong support around $1.90 before stabilizing toward $2.30. The lack of a significant buying surge suggests that the current price action is more of a recovery than a strong bullish trend. Key resistance remains at $2.55 to $2.60, and unless the price decisively breaks through this level with higher volume, the overall trend remains uncertain. Holding above $2.10 to $2.20 is crucial for sustaining the current upward trajectory.
Oscillators present a neutral market stance, with the relative strength index (RSI) at 46.75, the Stochastic at 29.48, and the commodity channel index (CCI) at -32.63, all signaling indecision. The moving average convergence divergence (MACD) level at -0.09279 indicates a sell signal, while momentum (10) is in buy territory at -0.10196, hinting at potential short-term bullishness. Meanwhile, the awesome oscillator remains slightly negative, reflecting an overall weak trend without a clear direction.
Moving averages (MAs) reflect a bearish outlook in the short-to-mid-term, with the exponential moving average (EMA) 10 at 2.27937 suggesting a buy, while the simple moving average (SMA) 10 at 2.31070 signals a sell. The 20-period EMAs and SMAs also indicate a sell, reinforcing the downward pressure. Long-term trends provide some optimism, as the 200-period EMA and SMA remain in buy territory at 1.86573 and 1.63488, respectively. This divergence suggests that while XRP is experiencing near-term resistance, the broader trend still holds potential for a sustained recovery if key support levels are maintained.
Bull Verdict:
XRP’s price action shows signs of resilience, with consolidation near key support levels and a potential breakout forming. Despite mixed signals from oscillators and short-term moving averages, the broader trend suggests that a move above $2.40 could trigger bullish momentum toward the $2.50–$2.60 range. Holding above $2.20 strengthens the case for further upside, making this a buy-the-dip opportunity for traders anticipating a continuation of the recovery.
Bear Verdict:
XRP remains under pressure despite recent attempts to push higher, with multiple resistance levels preventing sustained upward movement. The presence of bearish moving averages and a lack of strong volume indicate that any short-term rallies may face rejection around $2.35–$2.40. If the price fails to hold above $2.20, a deeper retracement toward $2.00 or lower could be likely, reinforcing a cautious stance until stronger bullish confirmation emerges.