
XRP traded at $2.40 on May 10, 2025, with a total market capitalization of $140.48 billion and a 24-hour trading volume of $3.654 billion. The cryptocurrency fluctuated within a daily intraday price range of $2.33 to $2.42, reflecting mild volatility despite the broader bullish undertone.

XRP
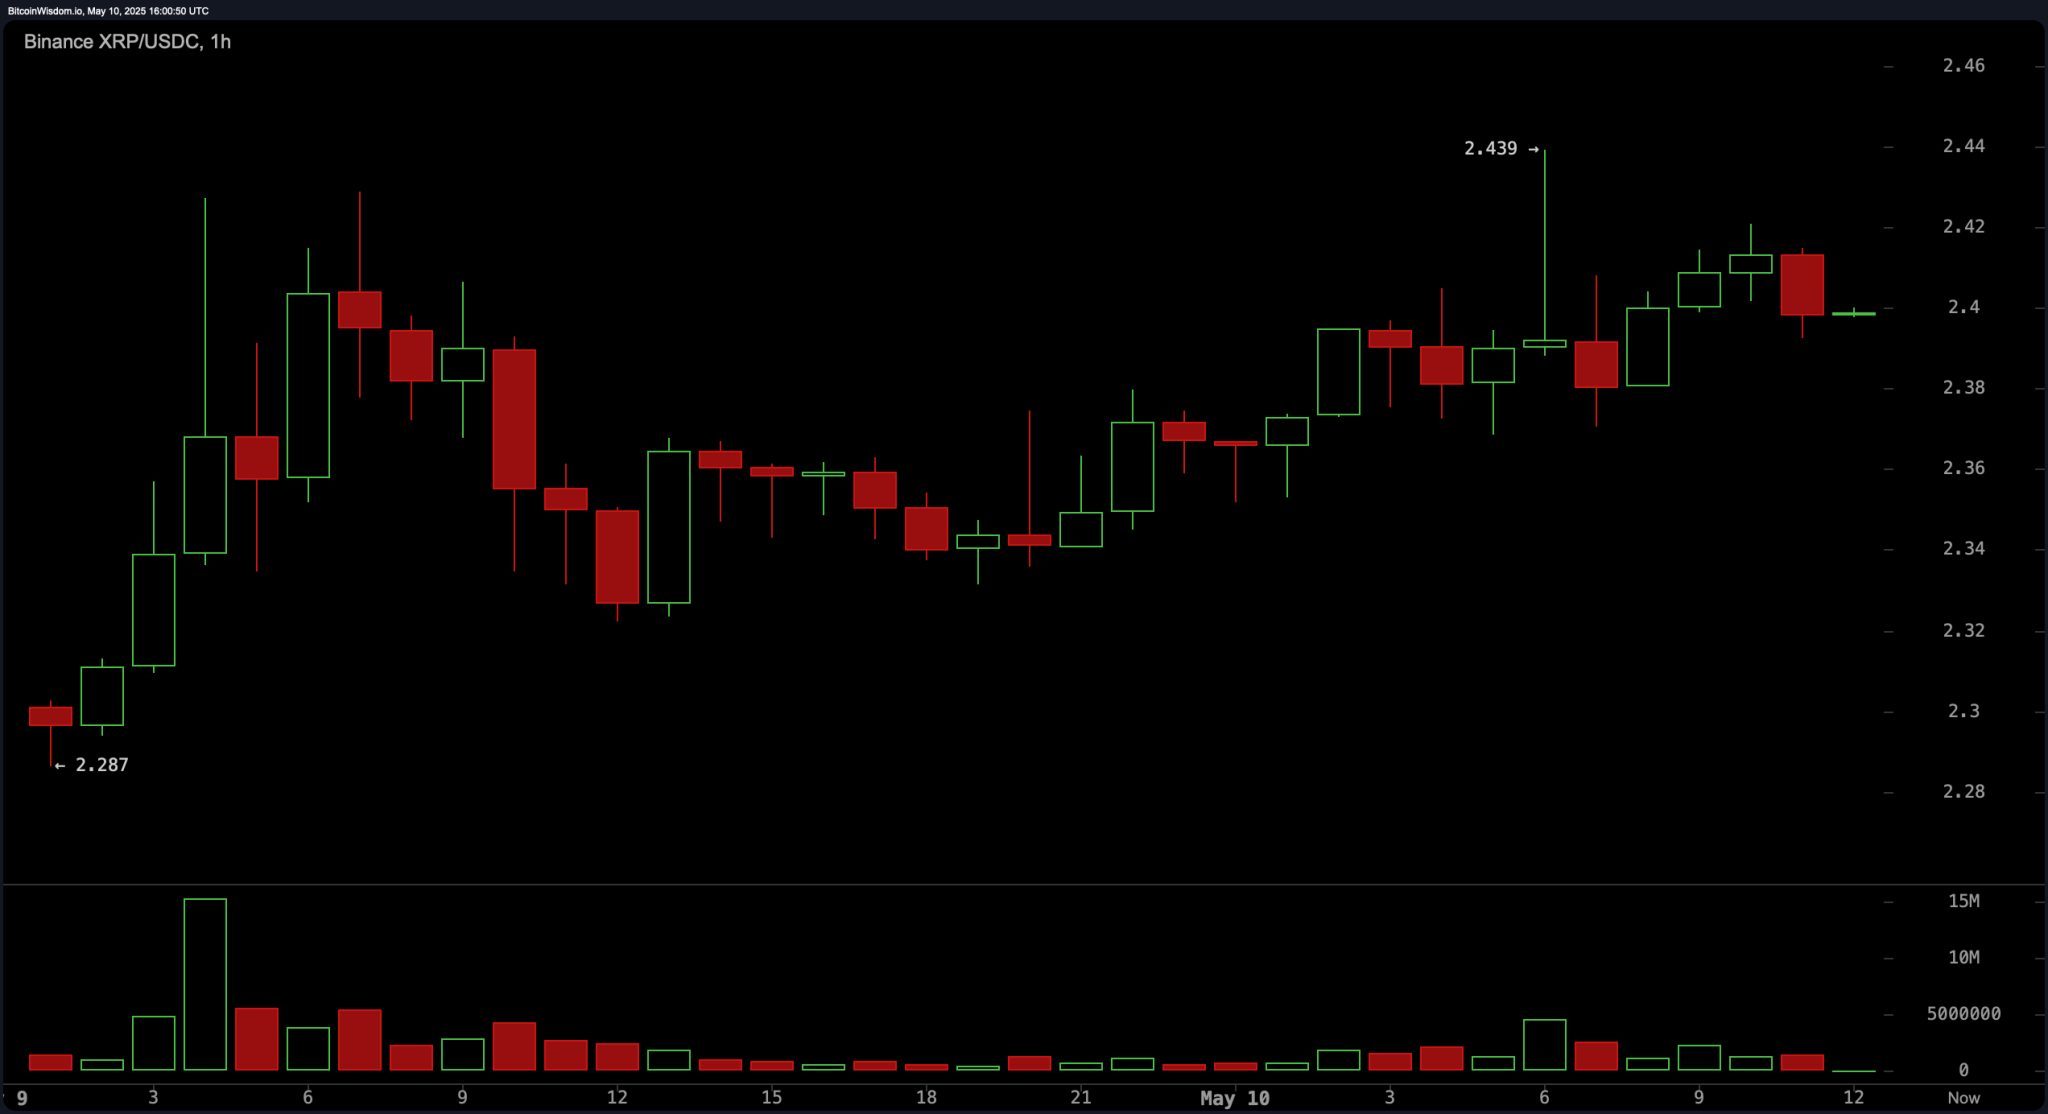
On the one-hour chart, XRP exhibited a short-term pullback from its recent high of $2.439 to a consolidation zone around $2.40. This minor correction appears to be driven by profit-taking rather than a fundamental shift in sentiment. The price remained range-bound between $2.38 and $2.42, with gradually declining volume—a technical indicator of healthy consolidation. A breakout above $2.44, accompanied by a volume surge, would signal renewed momentum and a potential continuation of the upward trend.
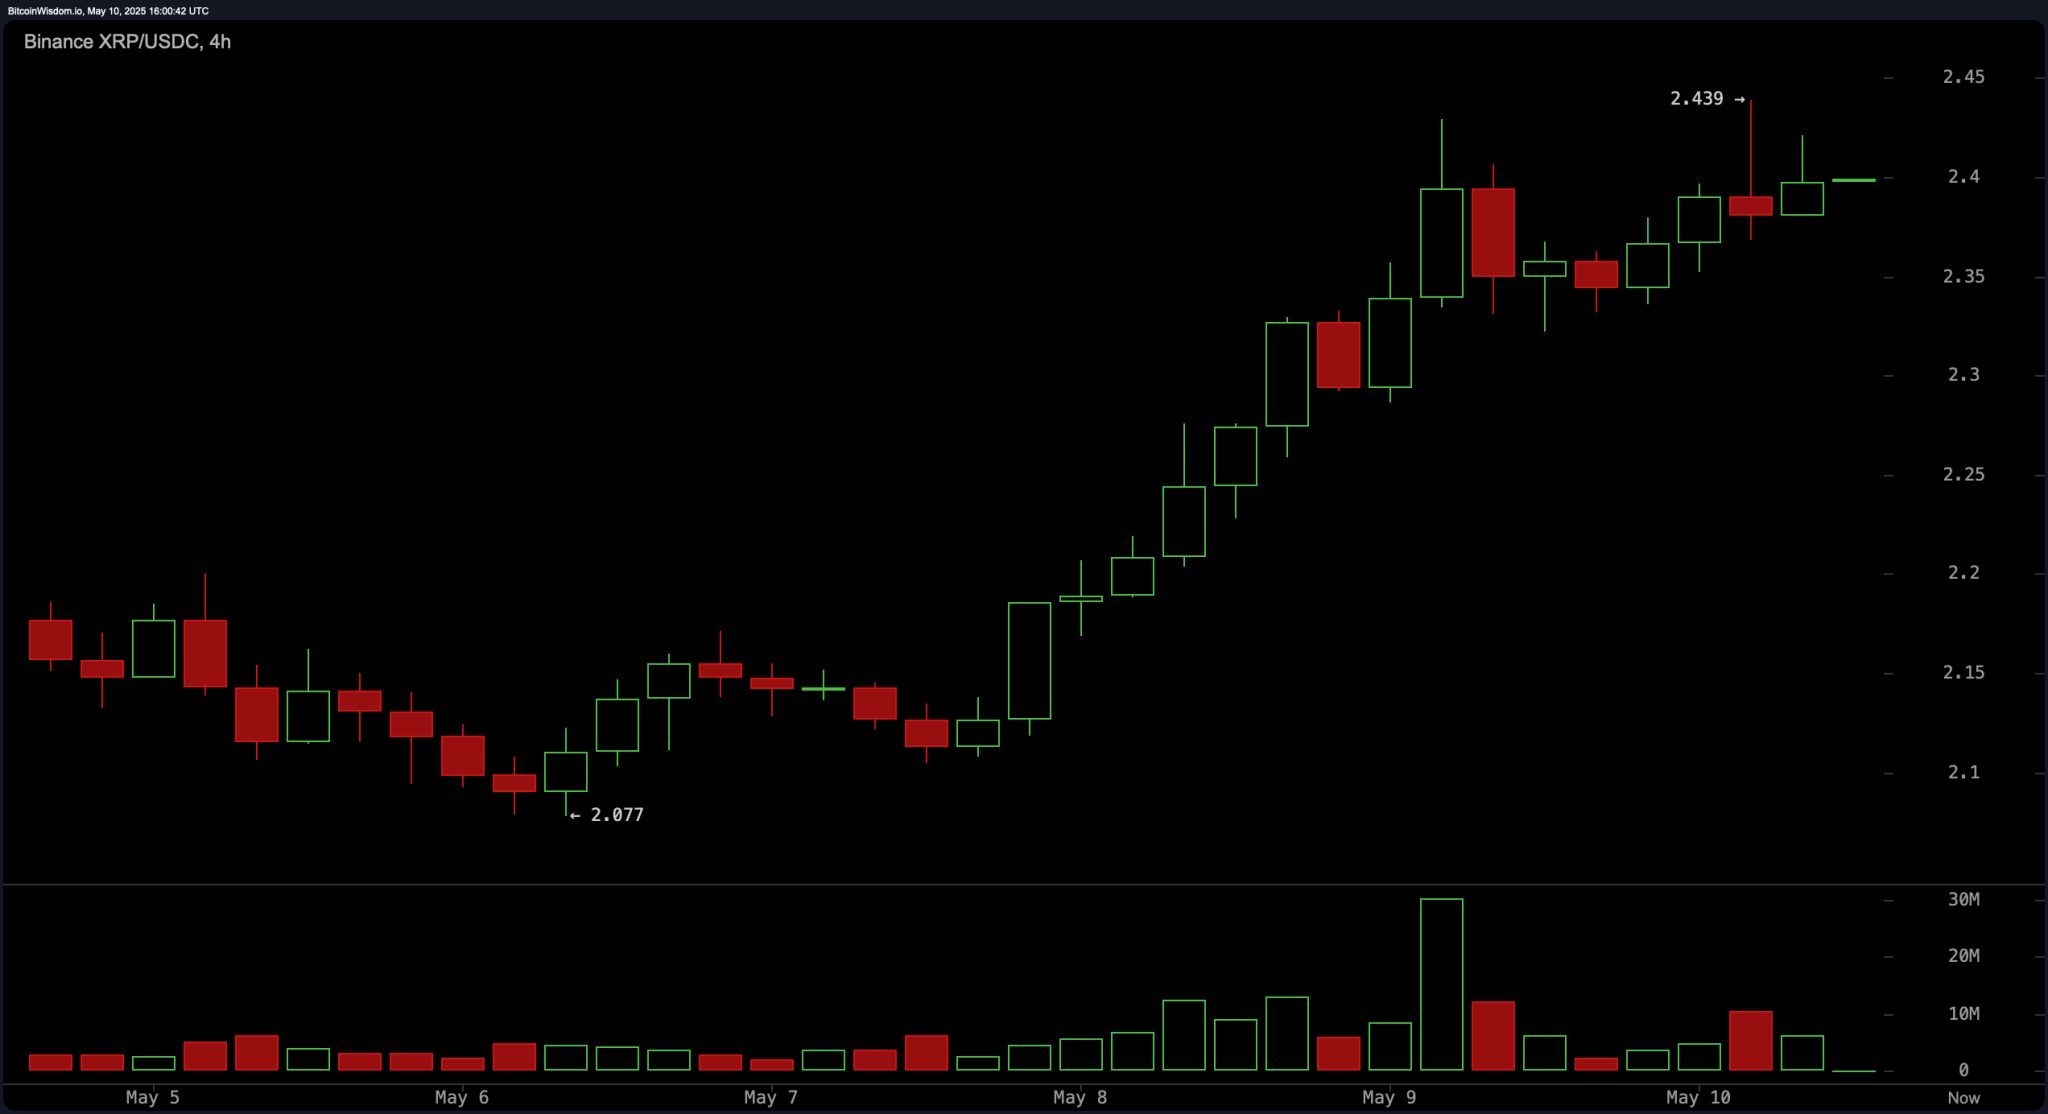
On the four-hour chart, the trend displayed strong bullish characteristics, as evidenced by a consistent pattern of higher highs and higher lows. The recent breakout from $2.077 to $2.439 occurred swiftly, underscoring aggressive buying interest. Currently, the asset is consolidating around $2.40, which could be forming a bullish flag—a classic continuation pattern. This setup supports the likelihood of a breakout above current resistance levels.
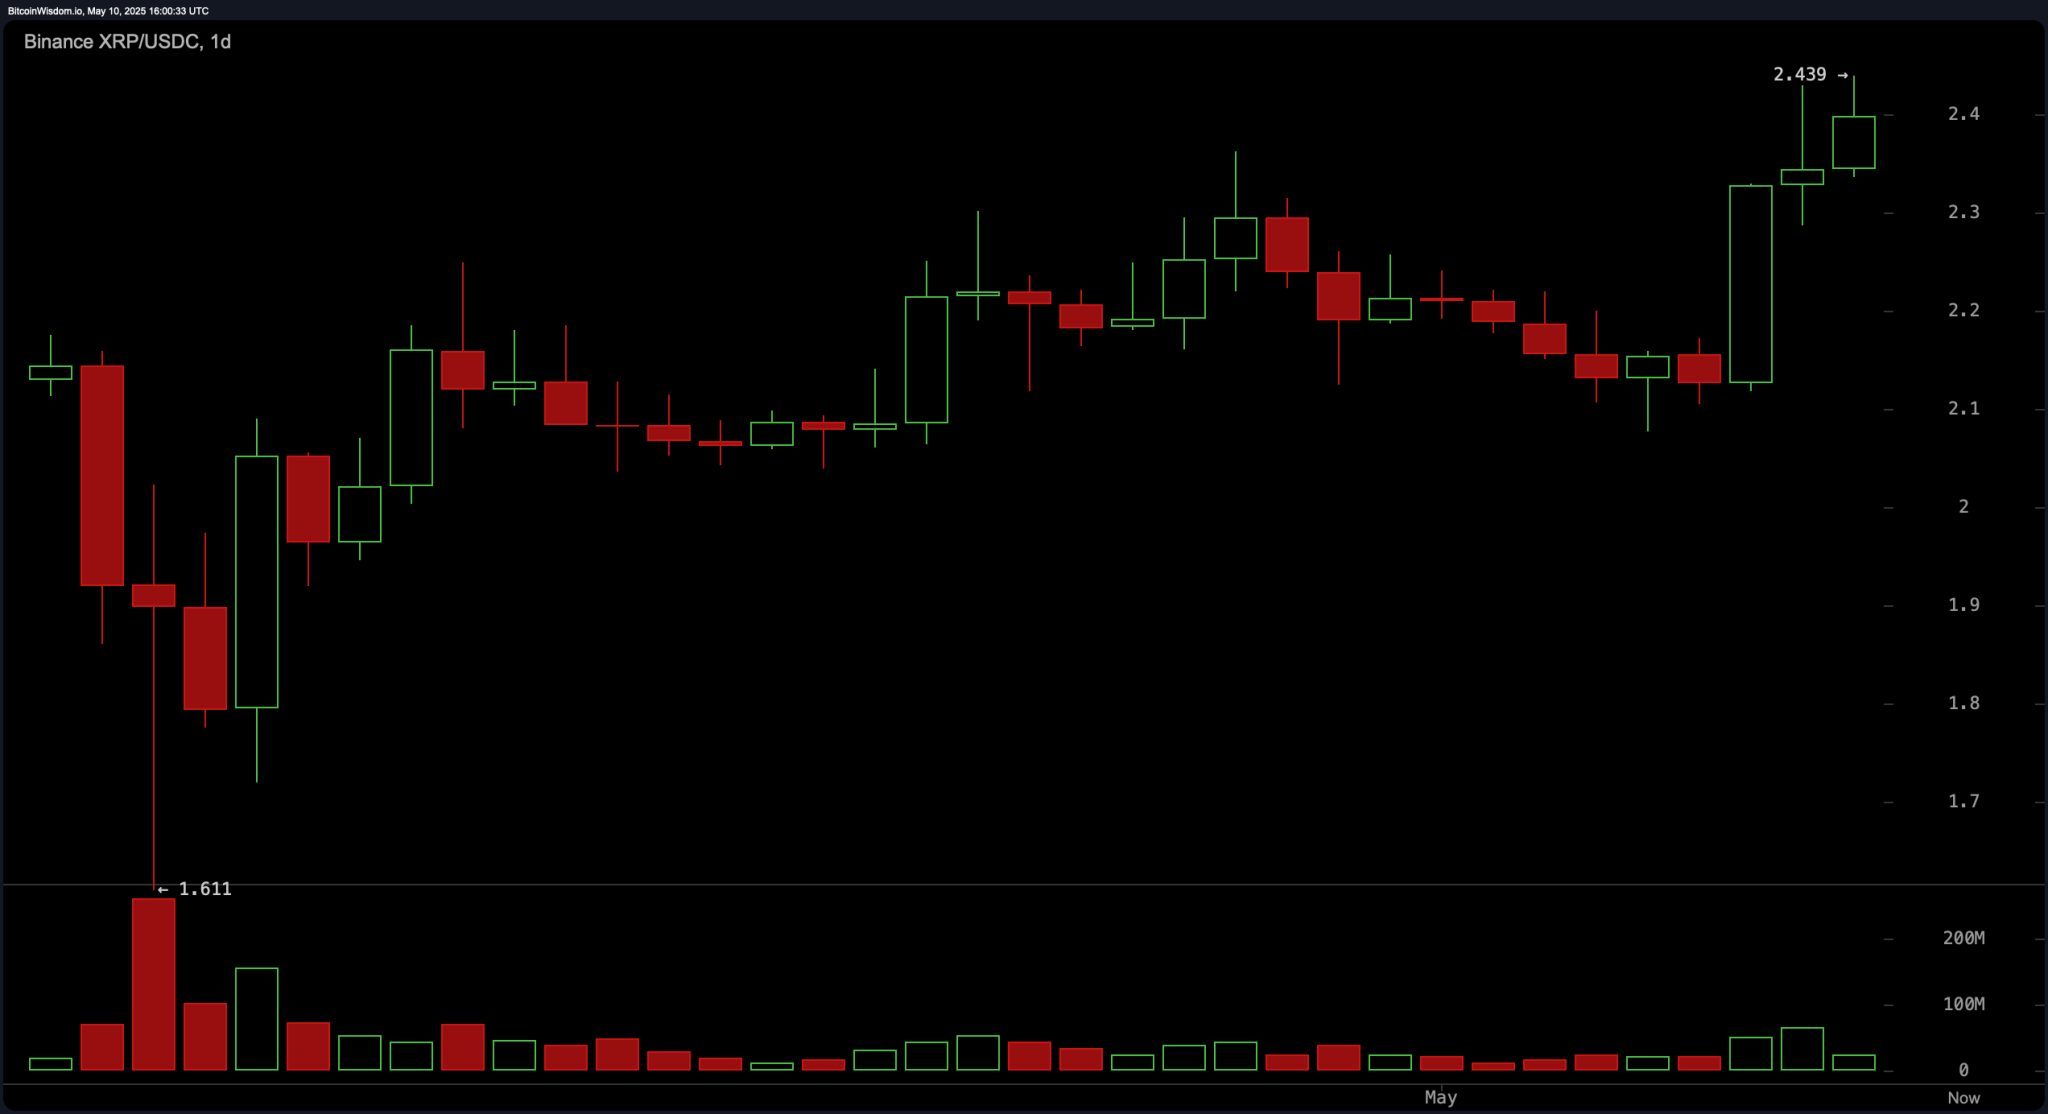
The daily chart offers a broader bullish perspective, following a prolonged period of sideways price action. A decisive breakout above $2.30 on elevated volume has confirmed the shift in market sentiment. This move was reinforced by a resistance flip, with $2.20 now acting as a solid support level. Traders may look for a pullback toward the $2.30–$2.33 zone to enter long positions, particularly if the dip occurs on lower volume, indicating weak selling pressure. A daily close above the minor resistance at $2.439 could open the door for an advance toward $2.50 or higher in the near term.
From an oscillator standpoint, indicators reflect a neutral-to-slightly-bullish bias. The relative strength index (rsi) reading of 65.41 suggests neither overbought nor oversold conditions, aligning with the current consolidation. The Stochastic oscillator stood at 84.14, also signaling neutrality but nearing overbought territory. The commodity channel index (CCI) registered 221.91, indicating a strong but not yet overheated trend. The average directional index (ADX) remained low at 13.90, highlighting a developing rather than fully established trend. The awesome oscillator hovered at 0.10498, offering little directional conviction. Notably, the momentum indicator posted a positive value of 0.20744, and the moving average convergence divergence (MACD) level of 0.03856 showed a mild bullish signal.
Moving averages across all standard periods unanimously supported a bullish outlook. The exponential moving average (EMA) and simple moving average (SMA) values for 10, 20, 30, 50, 100, and 200 periods were all below the current price, reinforcing the trend’s upward direction. Specifically, the 10-period exponential moving average (EMA) and simple moving average (SMA) at $2.25541 and $2.22516, respectively, acted as immediate dynamic supports. Even longer-term moving averages, such as the 200-period exponential moving average (EMA) and simple moving average (SMA), stood at $2.00816 and $2.10893—well below the current market price. This alignment signals strong institutional confidence and long-term buying pressure in favor of XRP.
Bull Verdict:
XRP’s multi-timeframe technical structure supports a bullish stance, with consistent higher lows, a breakout above key resistance levels, and strong alignment across moving averages. As long as the price is above $2.30 and volume confirms breakouts, the path toward $2.50 remains viable in the near term.
Bear Verdict:
Despite recent bullish momentum, XRP’s overextended short-term indicators and weakening volume could signal exhaustion. A failure to hold above $2.36 or a bearish divergence in momentum may lead to a pullback toward $2.20, challenging the strength of the current uptrend.