
XRP traded at $2.19 on June 7, 2025, with a market capitalization of $128 billion and a 24-hour trading volume of $1.33 billion. The cryptocurrency moved within a tight intraday range of $2.16 to $2.19, suggesting subdued volatility ahead of a potential breakout.

XRP
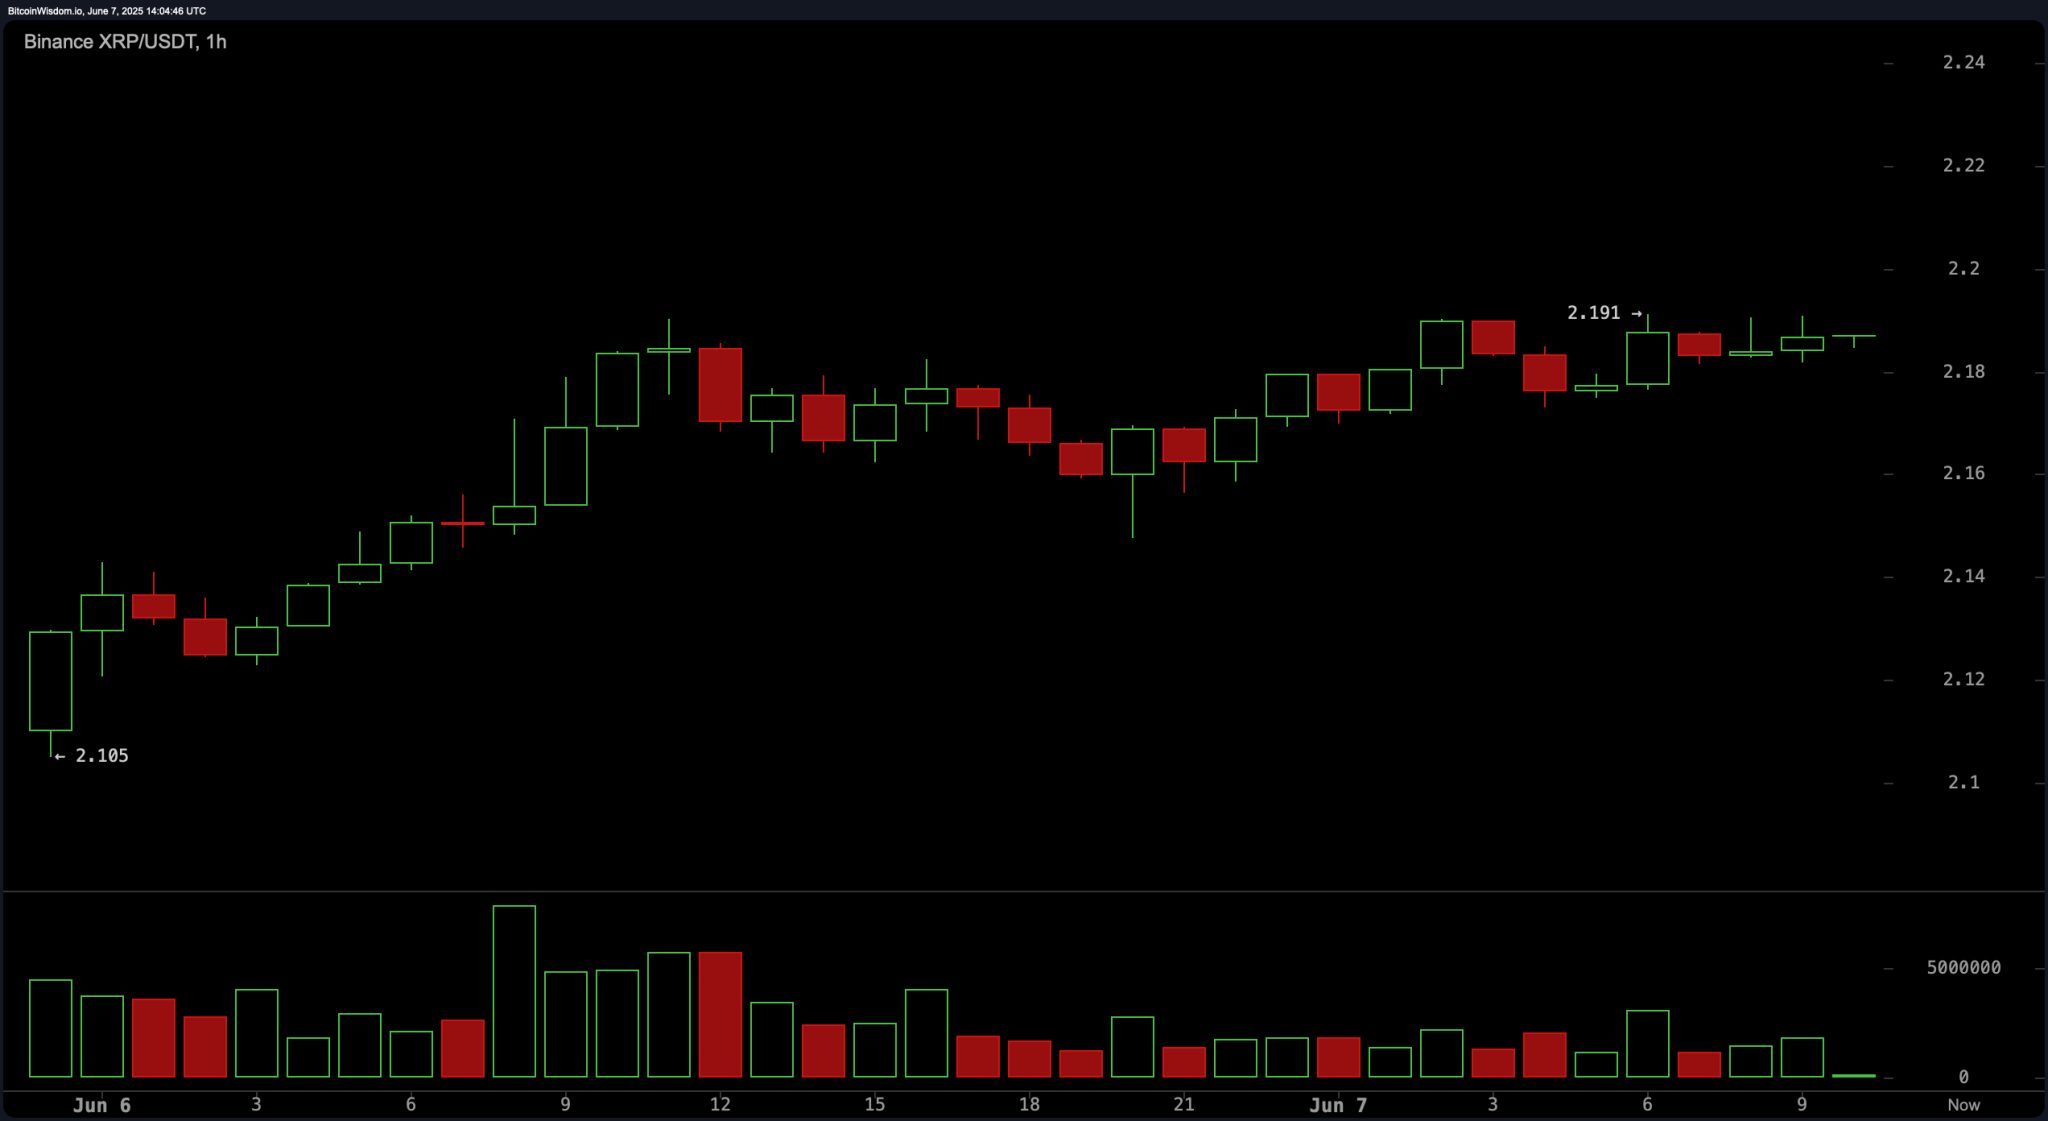
On the 1-hour chart, XRP displayed a tightly consolidated price action between $2.17 and $2.19. This narrow range reflected limited momentum as traders awaited a market catalyst. The short-term structure was characterized by low volatility and indecisive sentiment, consistent with a coiling pattern potentially preceding a breakout. Key levels to monitor are a clean break above $2.20, which could trigger a move toward $2.24 to $2.26, or a drop below $2.15 that may initiate a decline to $2.10. Current price action favors nimble scalping strategies while larger directional plays await confirmation.
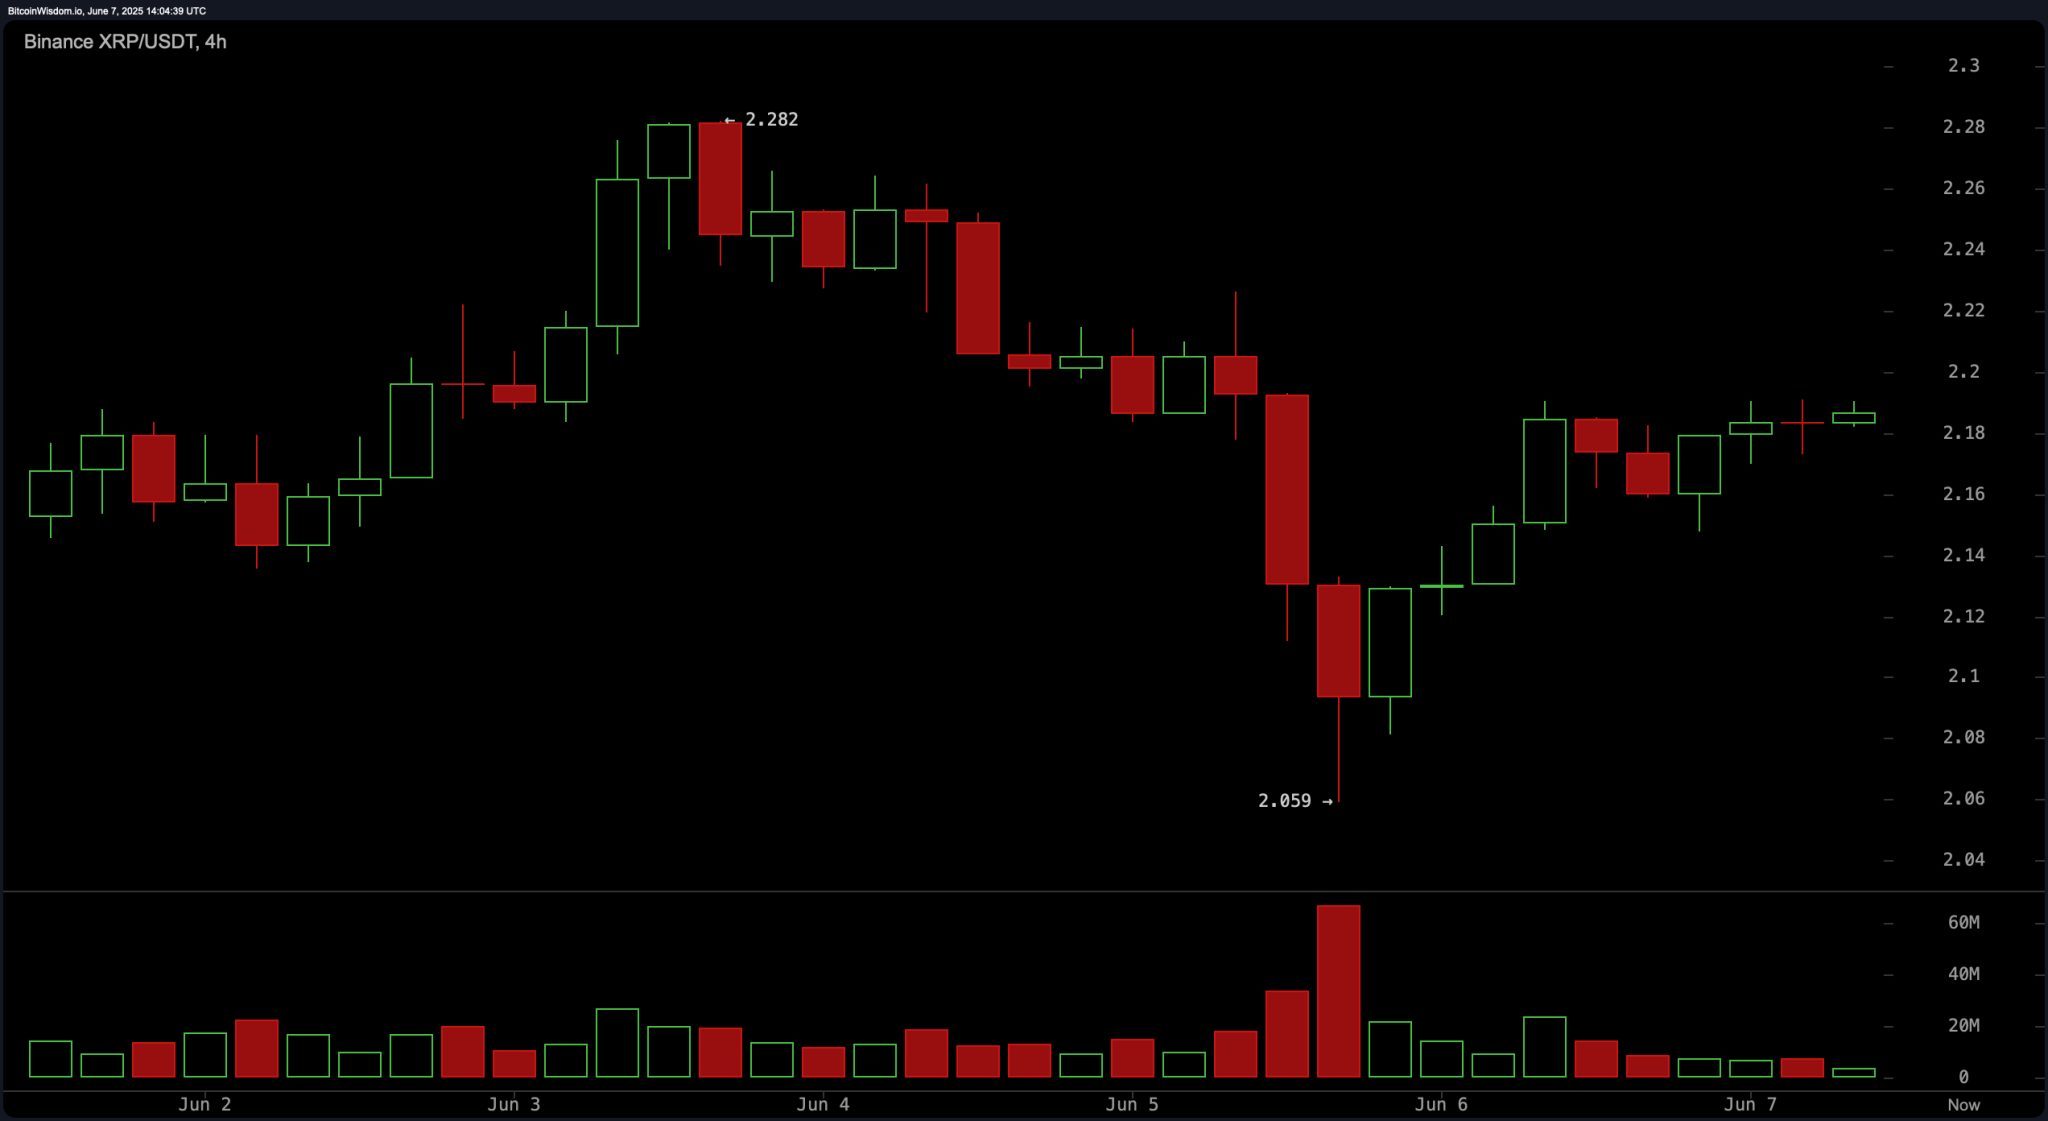
The 4-hour chart indicated a recovery attempt following a sharp decline, with XRP rebounding from a double-bottom pattern near $2.059. While the price has managed to reclaim the $2.18 level, upward momentum appears to be waning. The presence of strong resistance around $2.28 and weakening follow-through raises concerns of a bear flag formation. Traders should consider tactical long entries from $2.14 to $2.20 while closely observing price behavior around $2.28; failure to breach this resistance could provide an opportunity for short positions aiming for a move back toward $2.10.
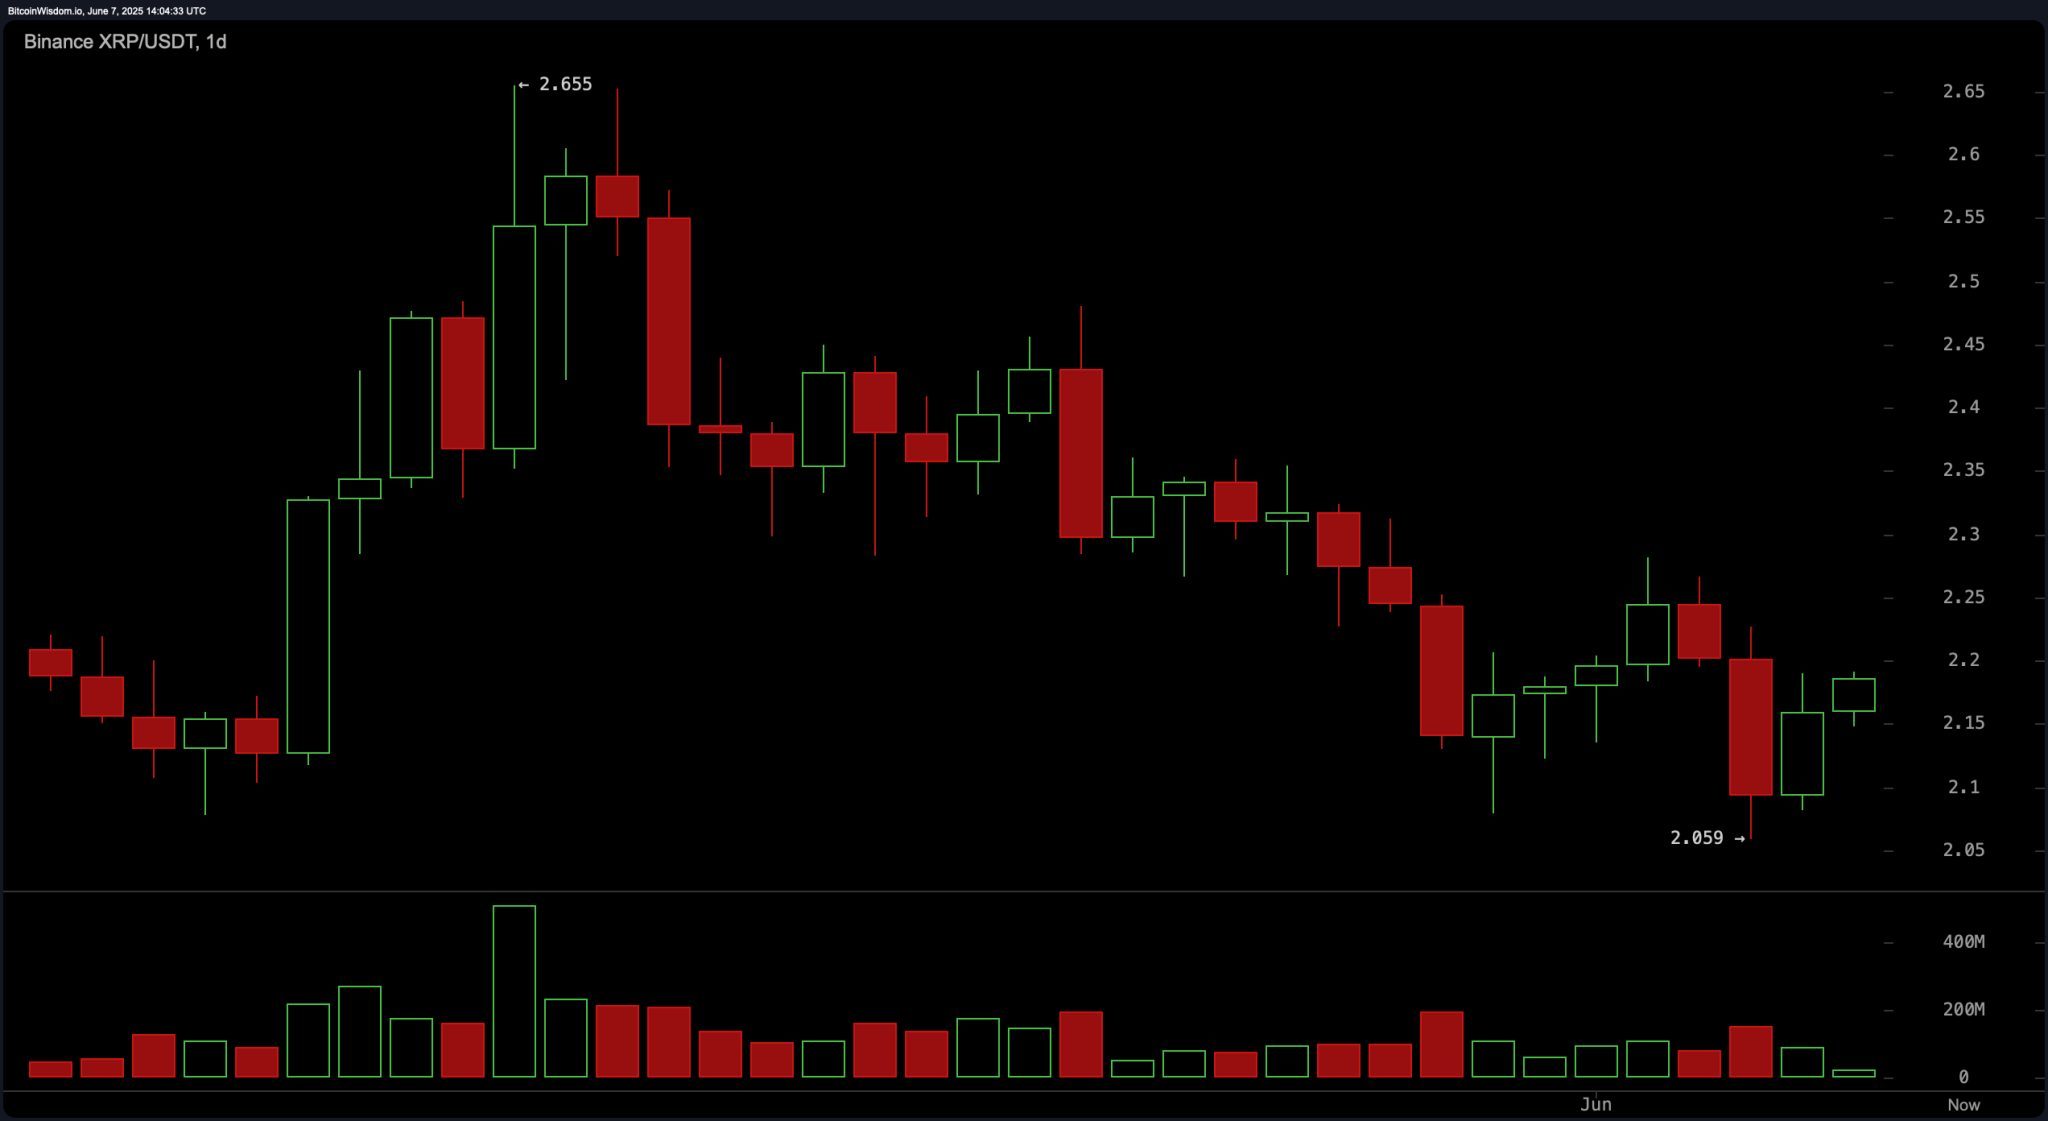
From a daily chart perspective, XRP remains in a mid-term downtrend after retreating from its peak of $2.655. The token is currently attempting to base around $2.06 to $2.15 after testing this support level. Resistance lies in the $2.25 to $2.30 zone, and declining volume signals a lack of strong buying interest following the prior sell-off. A sustained move above $2.25, preferably accompanied by a bullish engulfing candle and a notable increase in volume, would be needed to confirm any trend reversal. Until then, downside risk persists if support near $2.06 is breached.
Oscillator readings as of June 7 presented a largely neutral stance across the board, with the relative strength index (RSI) at 45.12, the Stochastic oscillator at 28.31, and the commodity channel index (CCI) at -73.92. The average directional index (ADX) reading of 19.71 highlighted a weak trend strength, while the Awesome oscillator showed a slight bearish bias at -0.11975. Momentum remained modestly bullish at -0.08820, whereas the moving average convergence divergence (MACD) level stood at -0.04065, indicating a bearish crossover and suggesting a continued lack of bullish momentum.
The analysis of moving averages (MAs) revealed a mixed to bearish technical outlook. The exponential moving average (EMA) over 10 periods was at $2.19808 with a sell signal, whereas the simple moving average (SMA) for the same period stood at $2.18286, signaling positivity. All other short-to-medium-term EMAs and SMAs — including 20, 30, 50, and 100 period measures — issued bearish signals, highlighting downward pressure. Only the 200-period EMA, at $2.08188, flashed a bullish signal, offering a faint positive undertone. The 200-period SMA, however, at $2.34319, remained firmly in bearish territory, reinforcing the current negative momentum unless a significant reversal occurs.
Bull Verdict:
If XRP sustains price action above $2.20 and breaks through resistance at $2.25 with supporting volume, it could confirm a bullish reversal. A reclaim of the 20-period moving averages alongside positive momentum divergence would validate upward continuation toward $2.30 and potentially higher levels.
Bear Verdict:
Should XRP fail to hold above the $2.15 support and break below $2.06, it would likely resume its broader downtrend. A bearish MACD crossover and persistent pressure below major moving averages suggest that a move toward $1.95 is plausible without a clear catalyst or volume-driven recovery.